

Democratic challenger Jamie Ager just posted a remarkable fundraising quarter in North Carolina’s 11th Congressional District, offering another piece of evidence that Republican incumbent Chuck Edwards may have a competitive race on his hands.1
Here is the story of this fundraising juggernaut in five graphs.2
What Fundraising Data Can Tell Us
Data on a district like the 11th can be hard to find. There is no polling to speak of, and the district is so large that even trying to pick up relevant vibes can obscure more than it reveals.
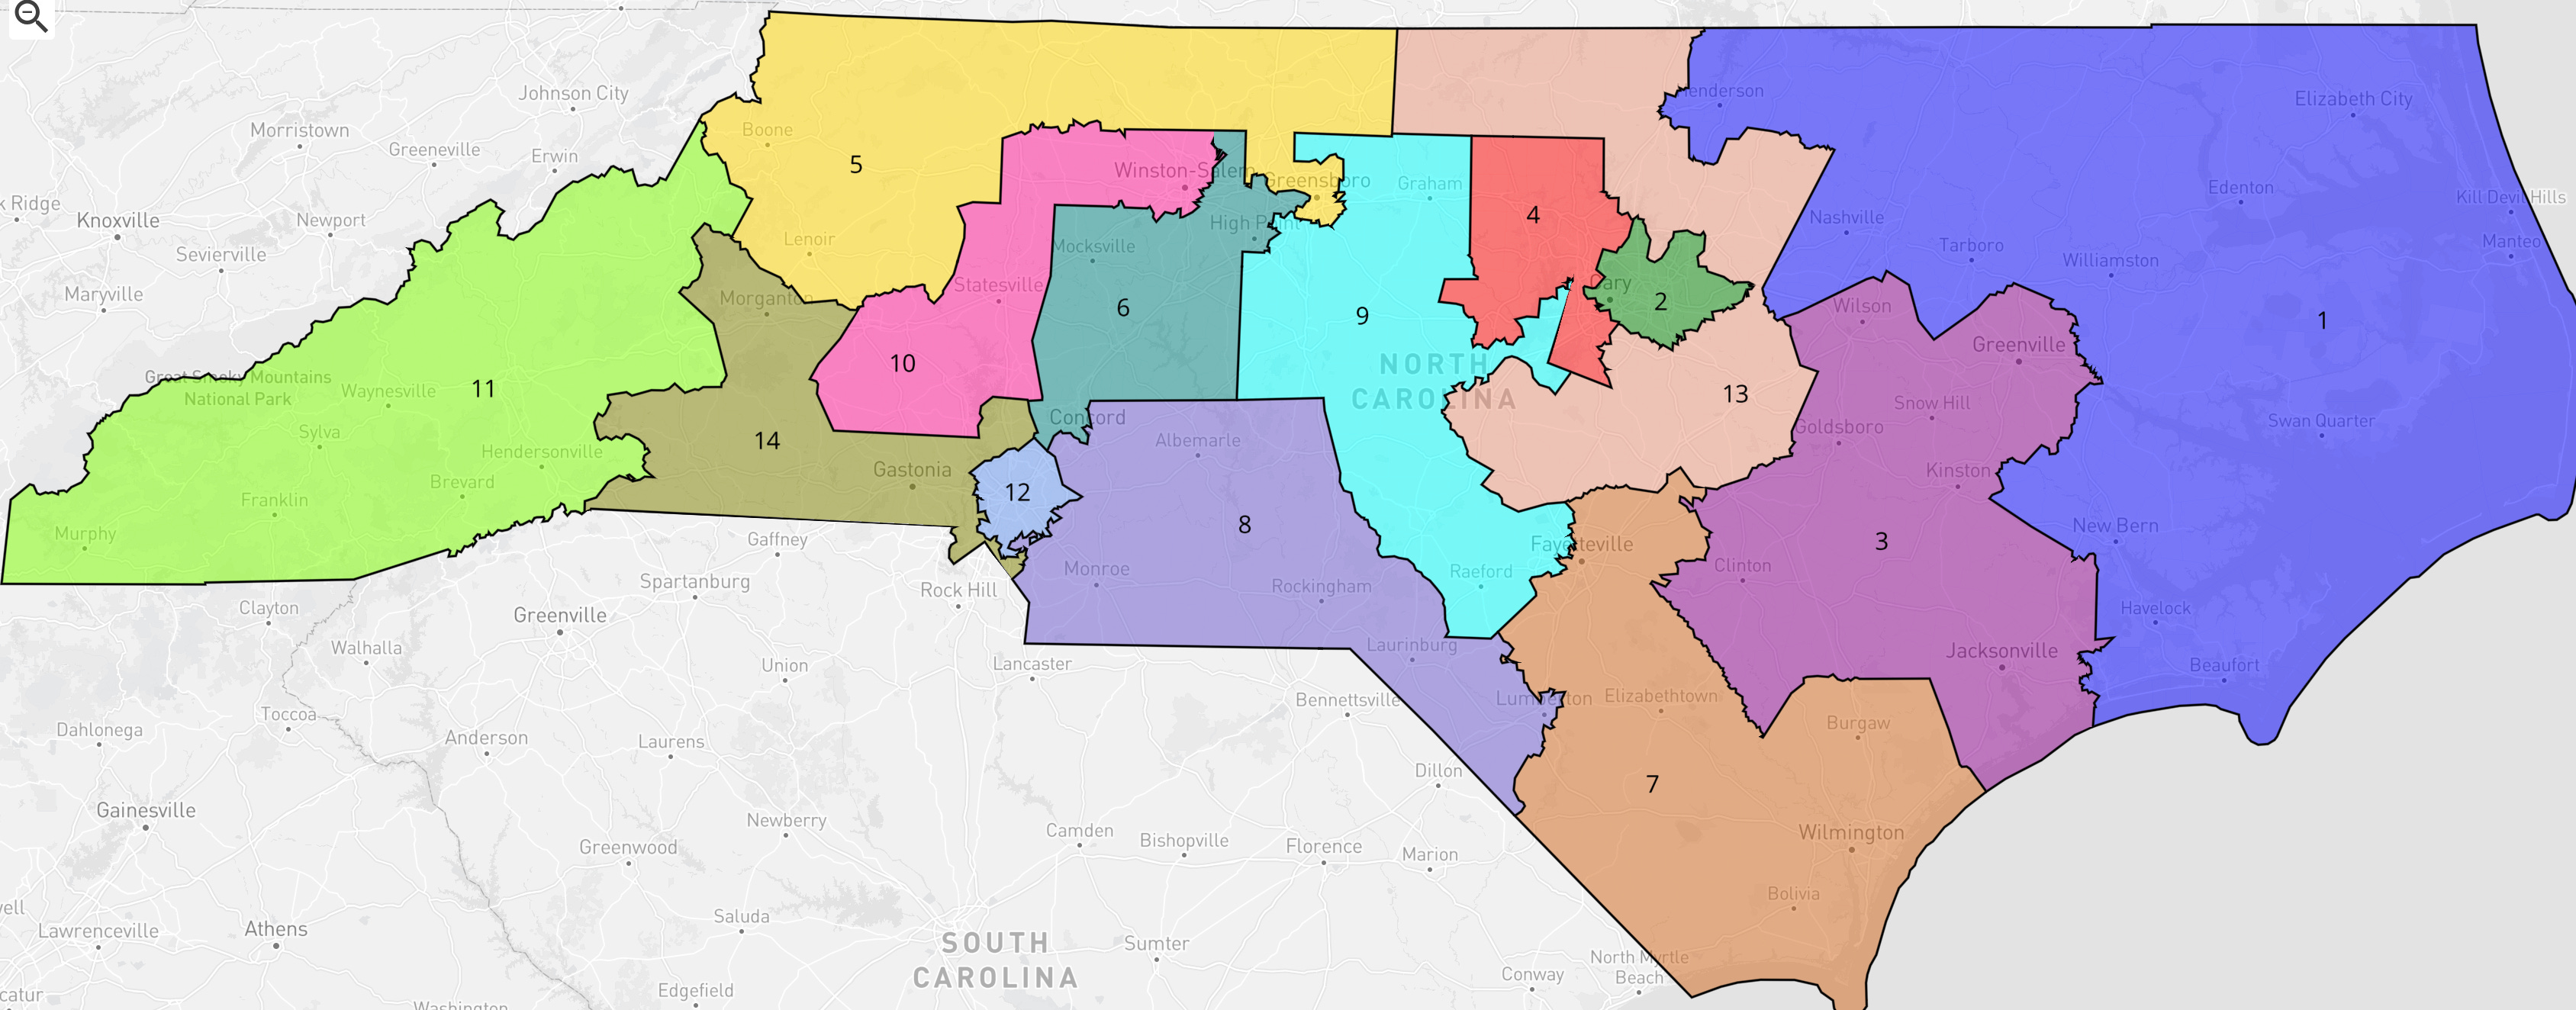
Fundraising prowess does not tell the whole story of an election (the candidate who raises the most money is not always the winner), but it does give us some clues. At the most basic level, fundraising tells us whether candidates have the resources to run ads, contact voters, test messages, and pay campaign consultants—all activities that can help win an election.
Fundraising is also an indicator of support. Few people give money to a candidate they will not vote for or talk up to their friends. Fundraising dollars from within the district, in particular, can give a rough measure of electoral support.
Fundraising from outside the district can also act as a prediction market of sorts. Donors and PACs generally prefer to invest in candidates with a plausible path to victory.
Candidates report their fundraising and spending to the Federal Election Commission at least four times a year. The second-quarter fundraising numbers (April 1-June 30) were just released.
On to the graphs.
Graph 1. Total Raised and Spent
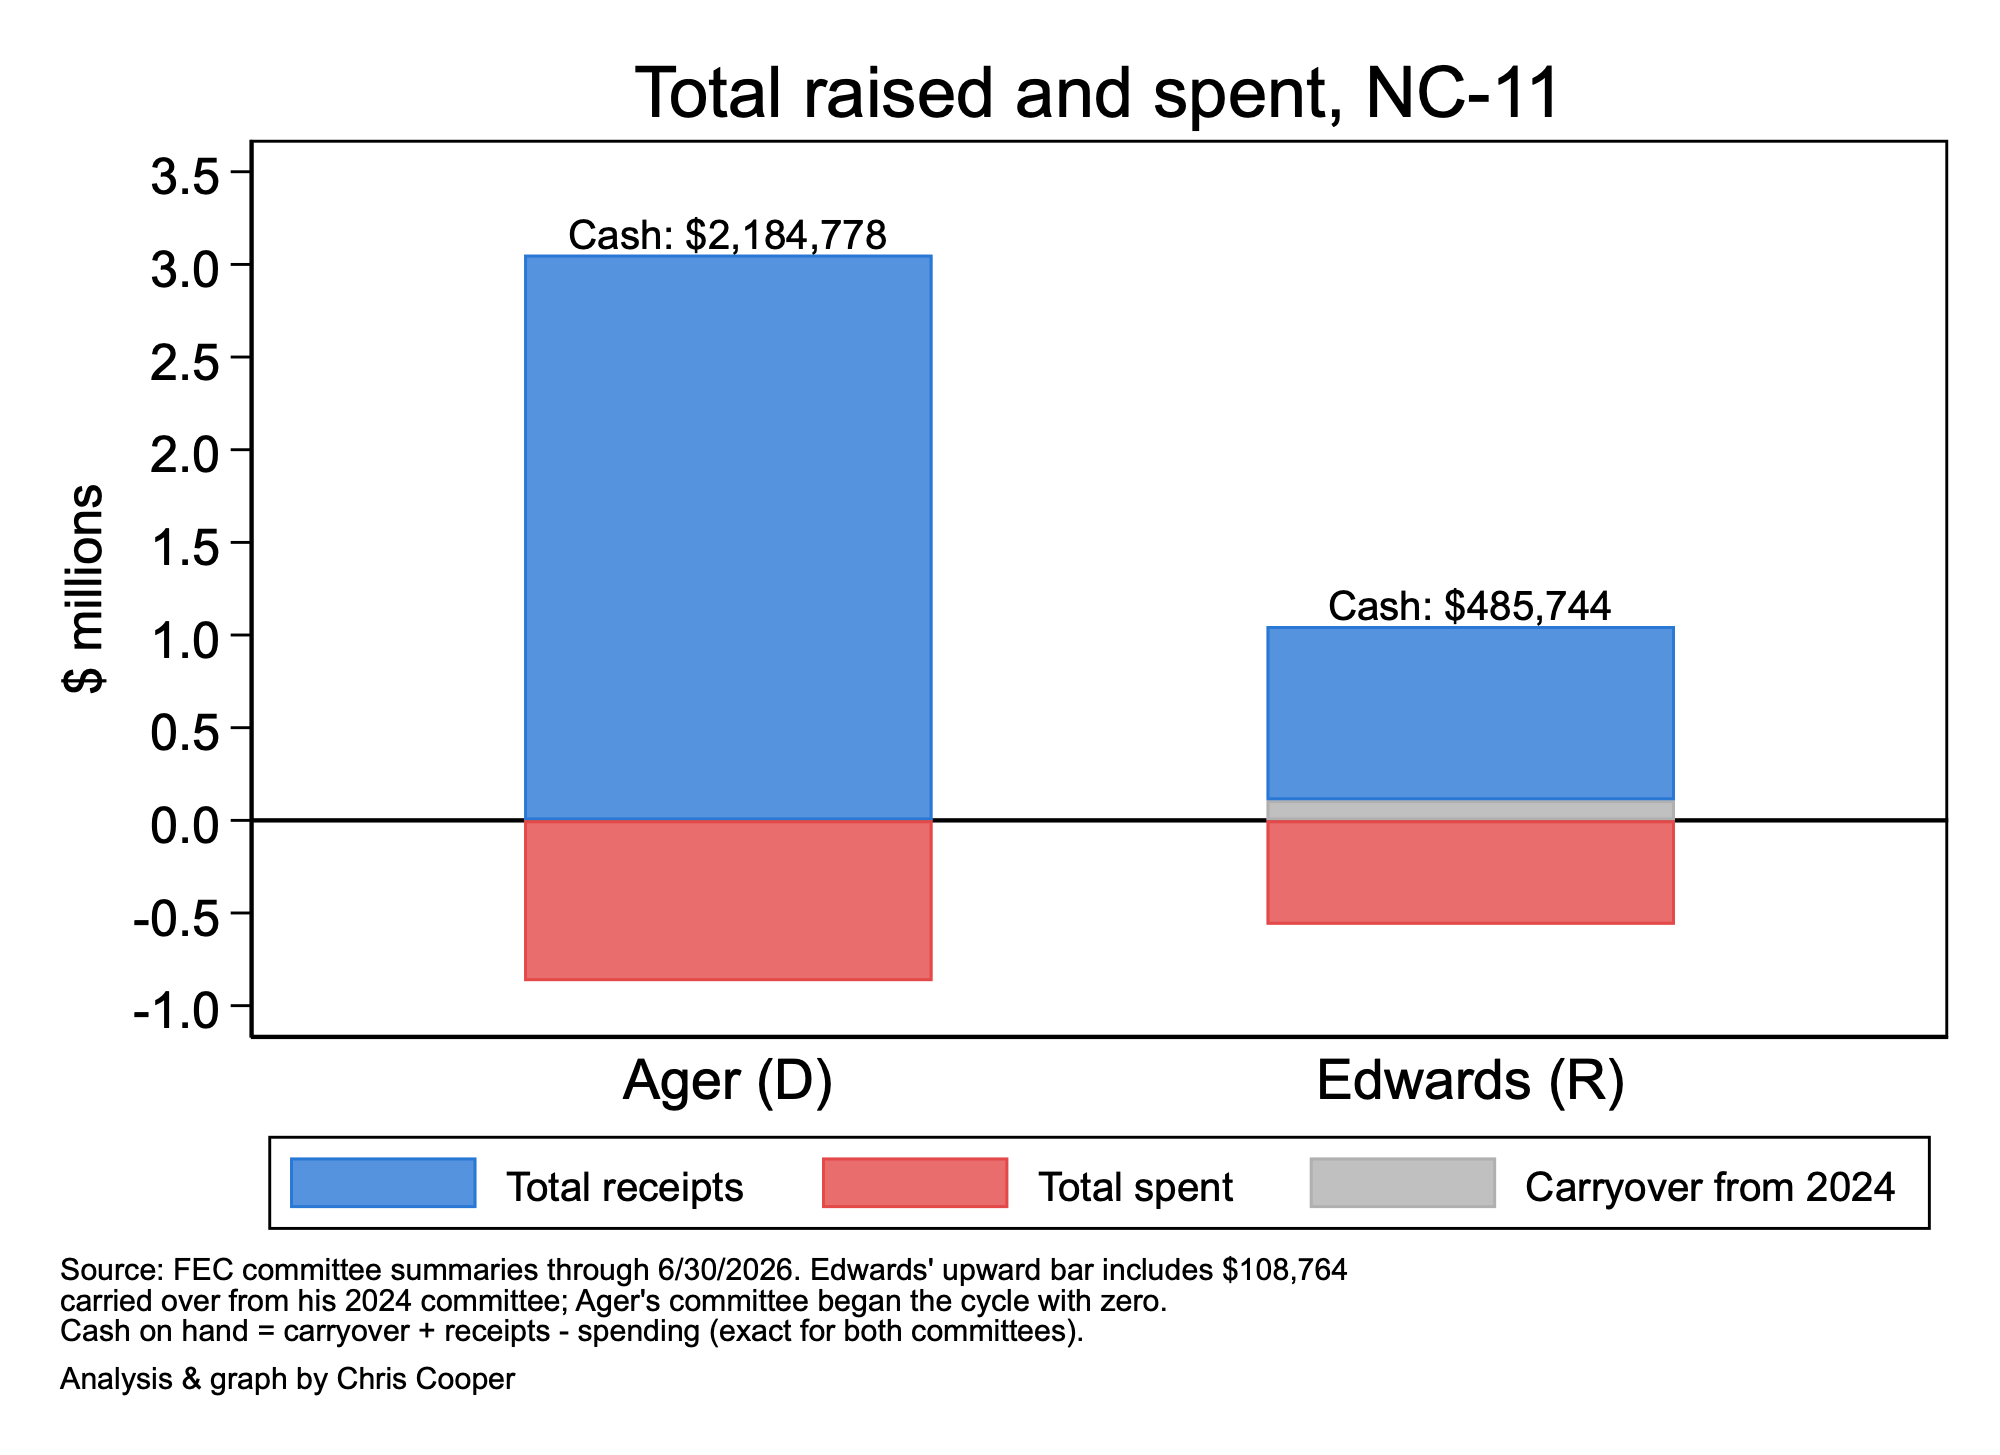
The first graph (below) shows the total receipts (this includes everything—donations of any size, PACs, etc.) in blue and the total expenditures in red. The cash on hand (how much money they have left in their accounts) is listed above each bar.3
As you can see, Ager has raised more than three times as much money as Edwards and currently has more than four times as much cash on hand. This is a big difference.
Graph 2. Monthly Itemized Receipts
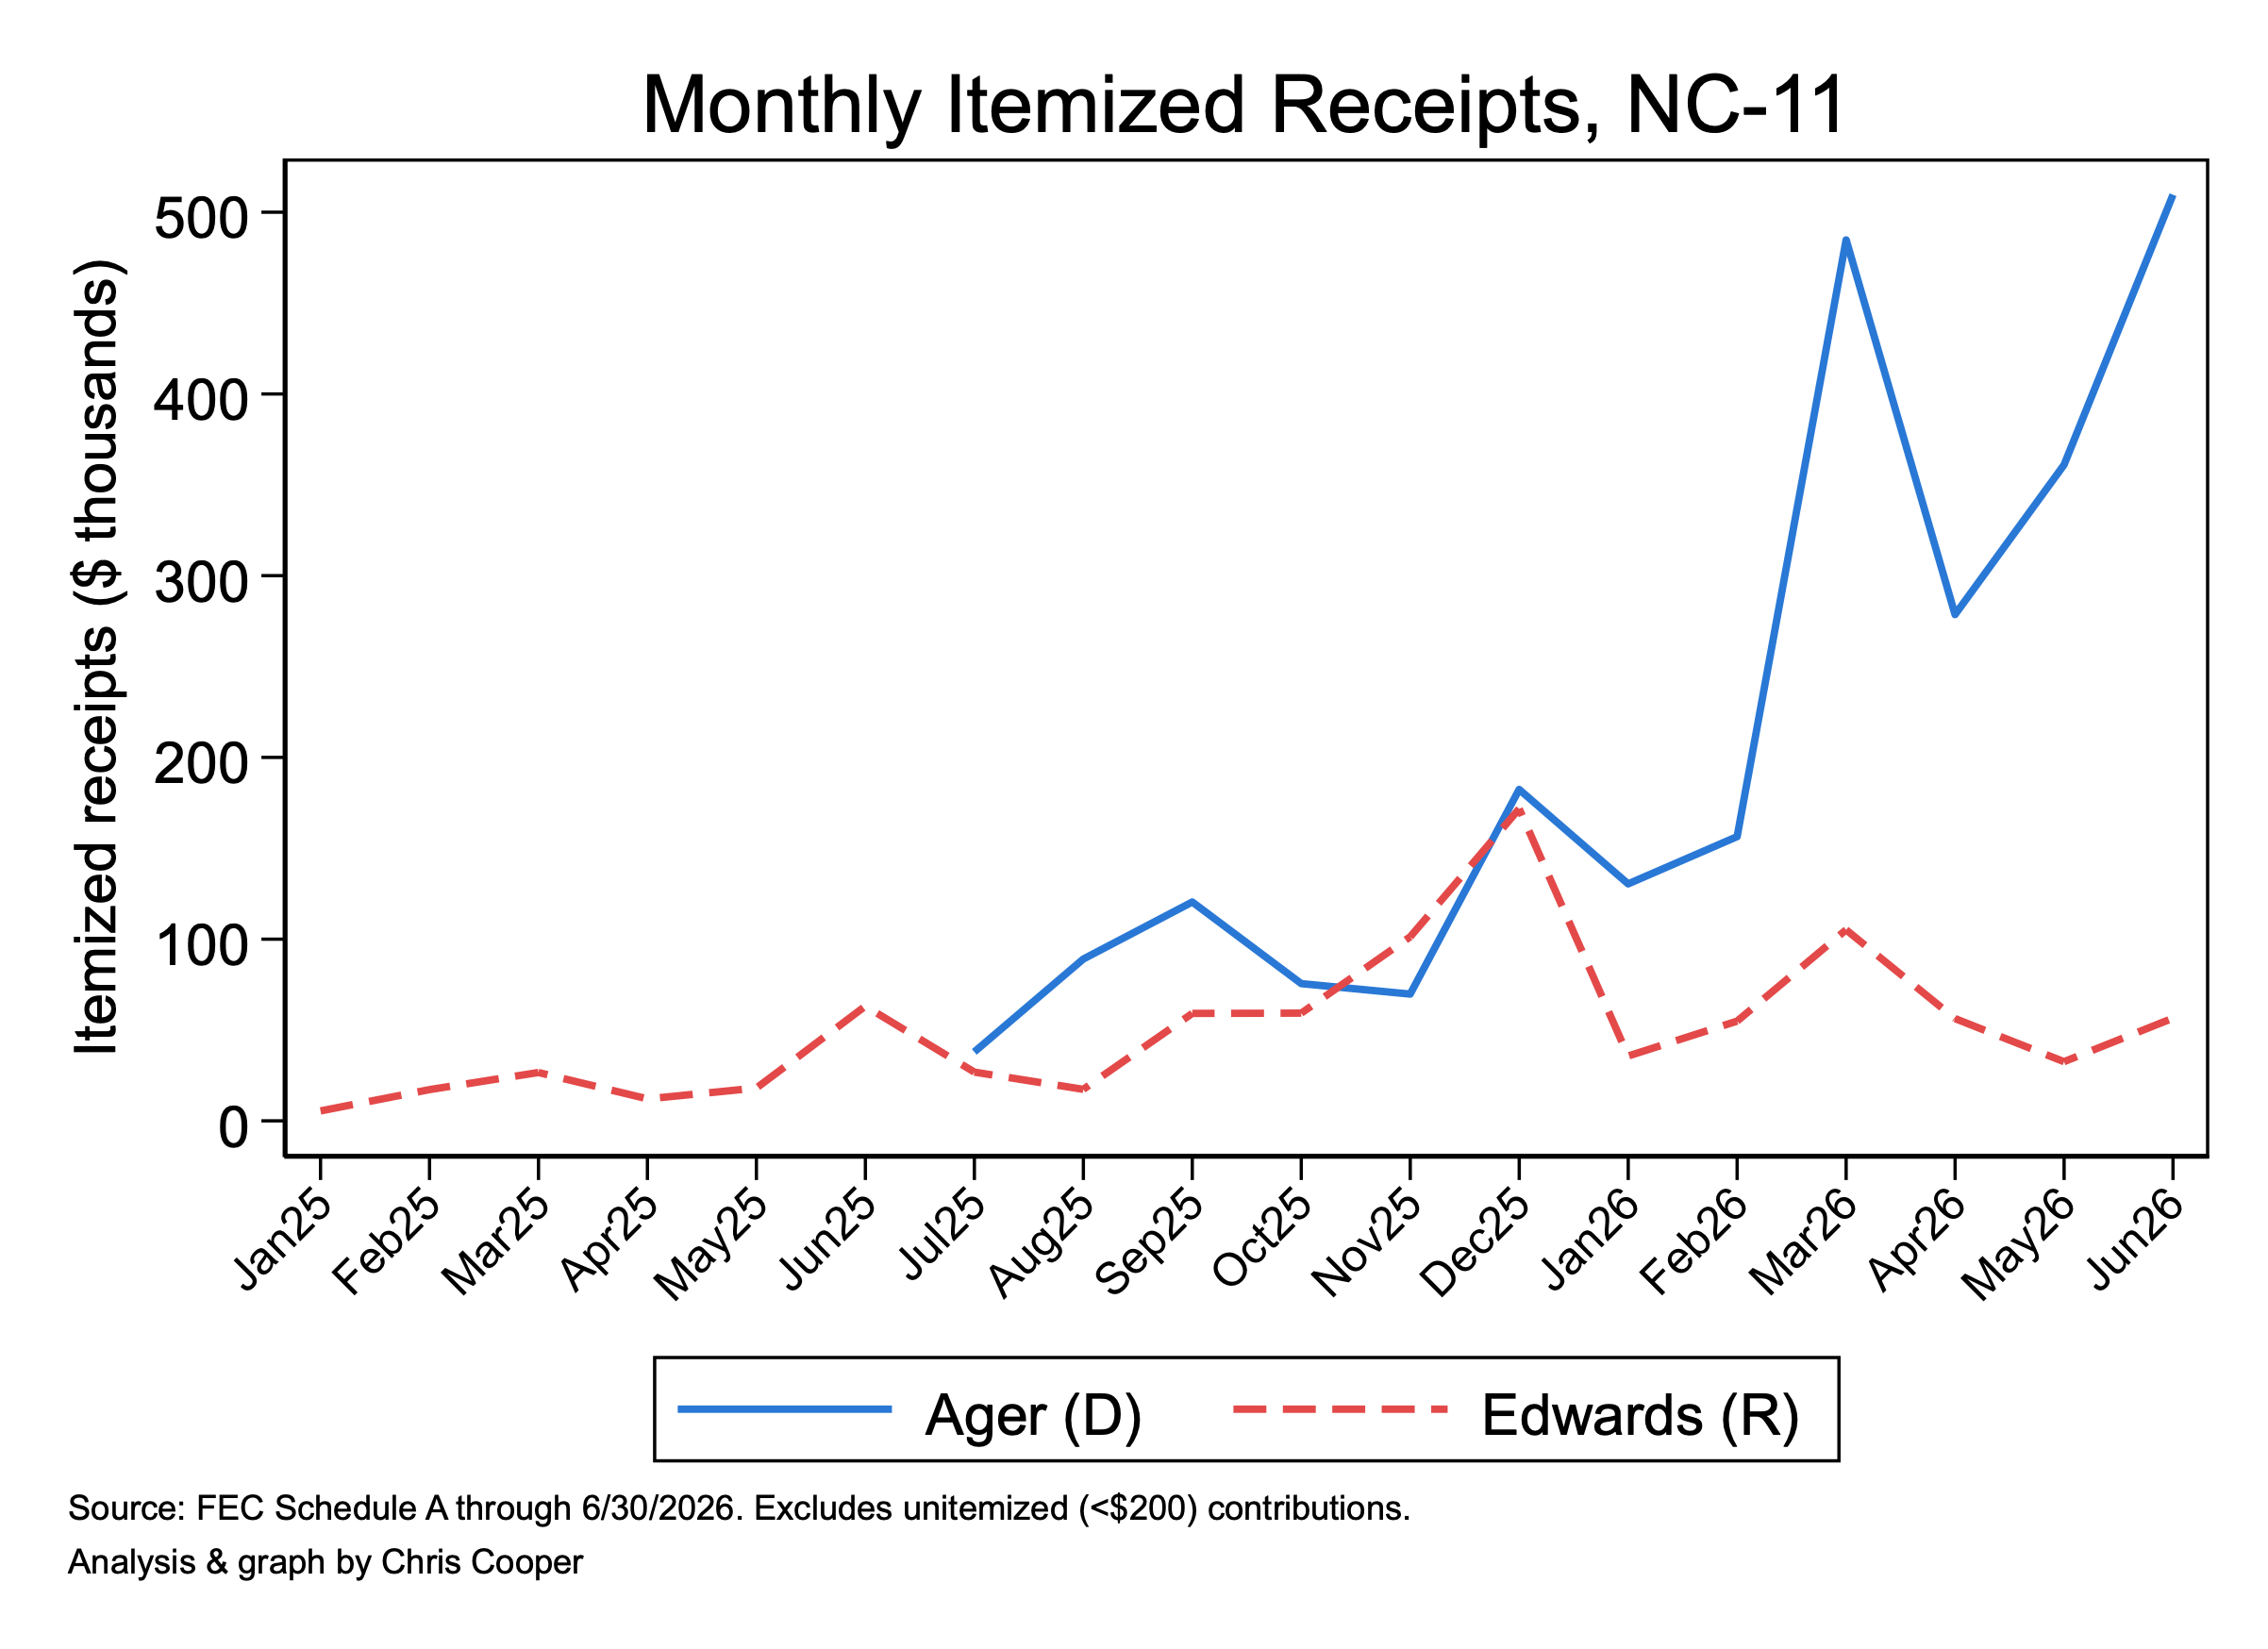
Graph 2 shows how much money in itemized receipts—donations large enough to be individually reported to the FEC, plus PAC money—was received by Ager (in blue) and Edwards (in red).4 As you can see, the gap between the two candidates is growing, not shrinking. Ager had his best fundraising month in June. June was remarkably average for Chuck Edwards.
Graph 3. Donor Geography
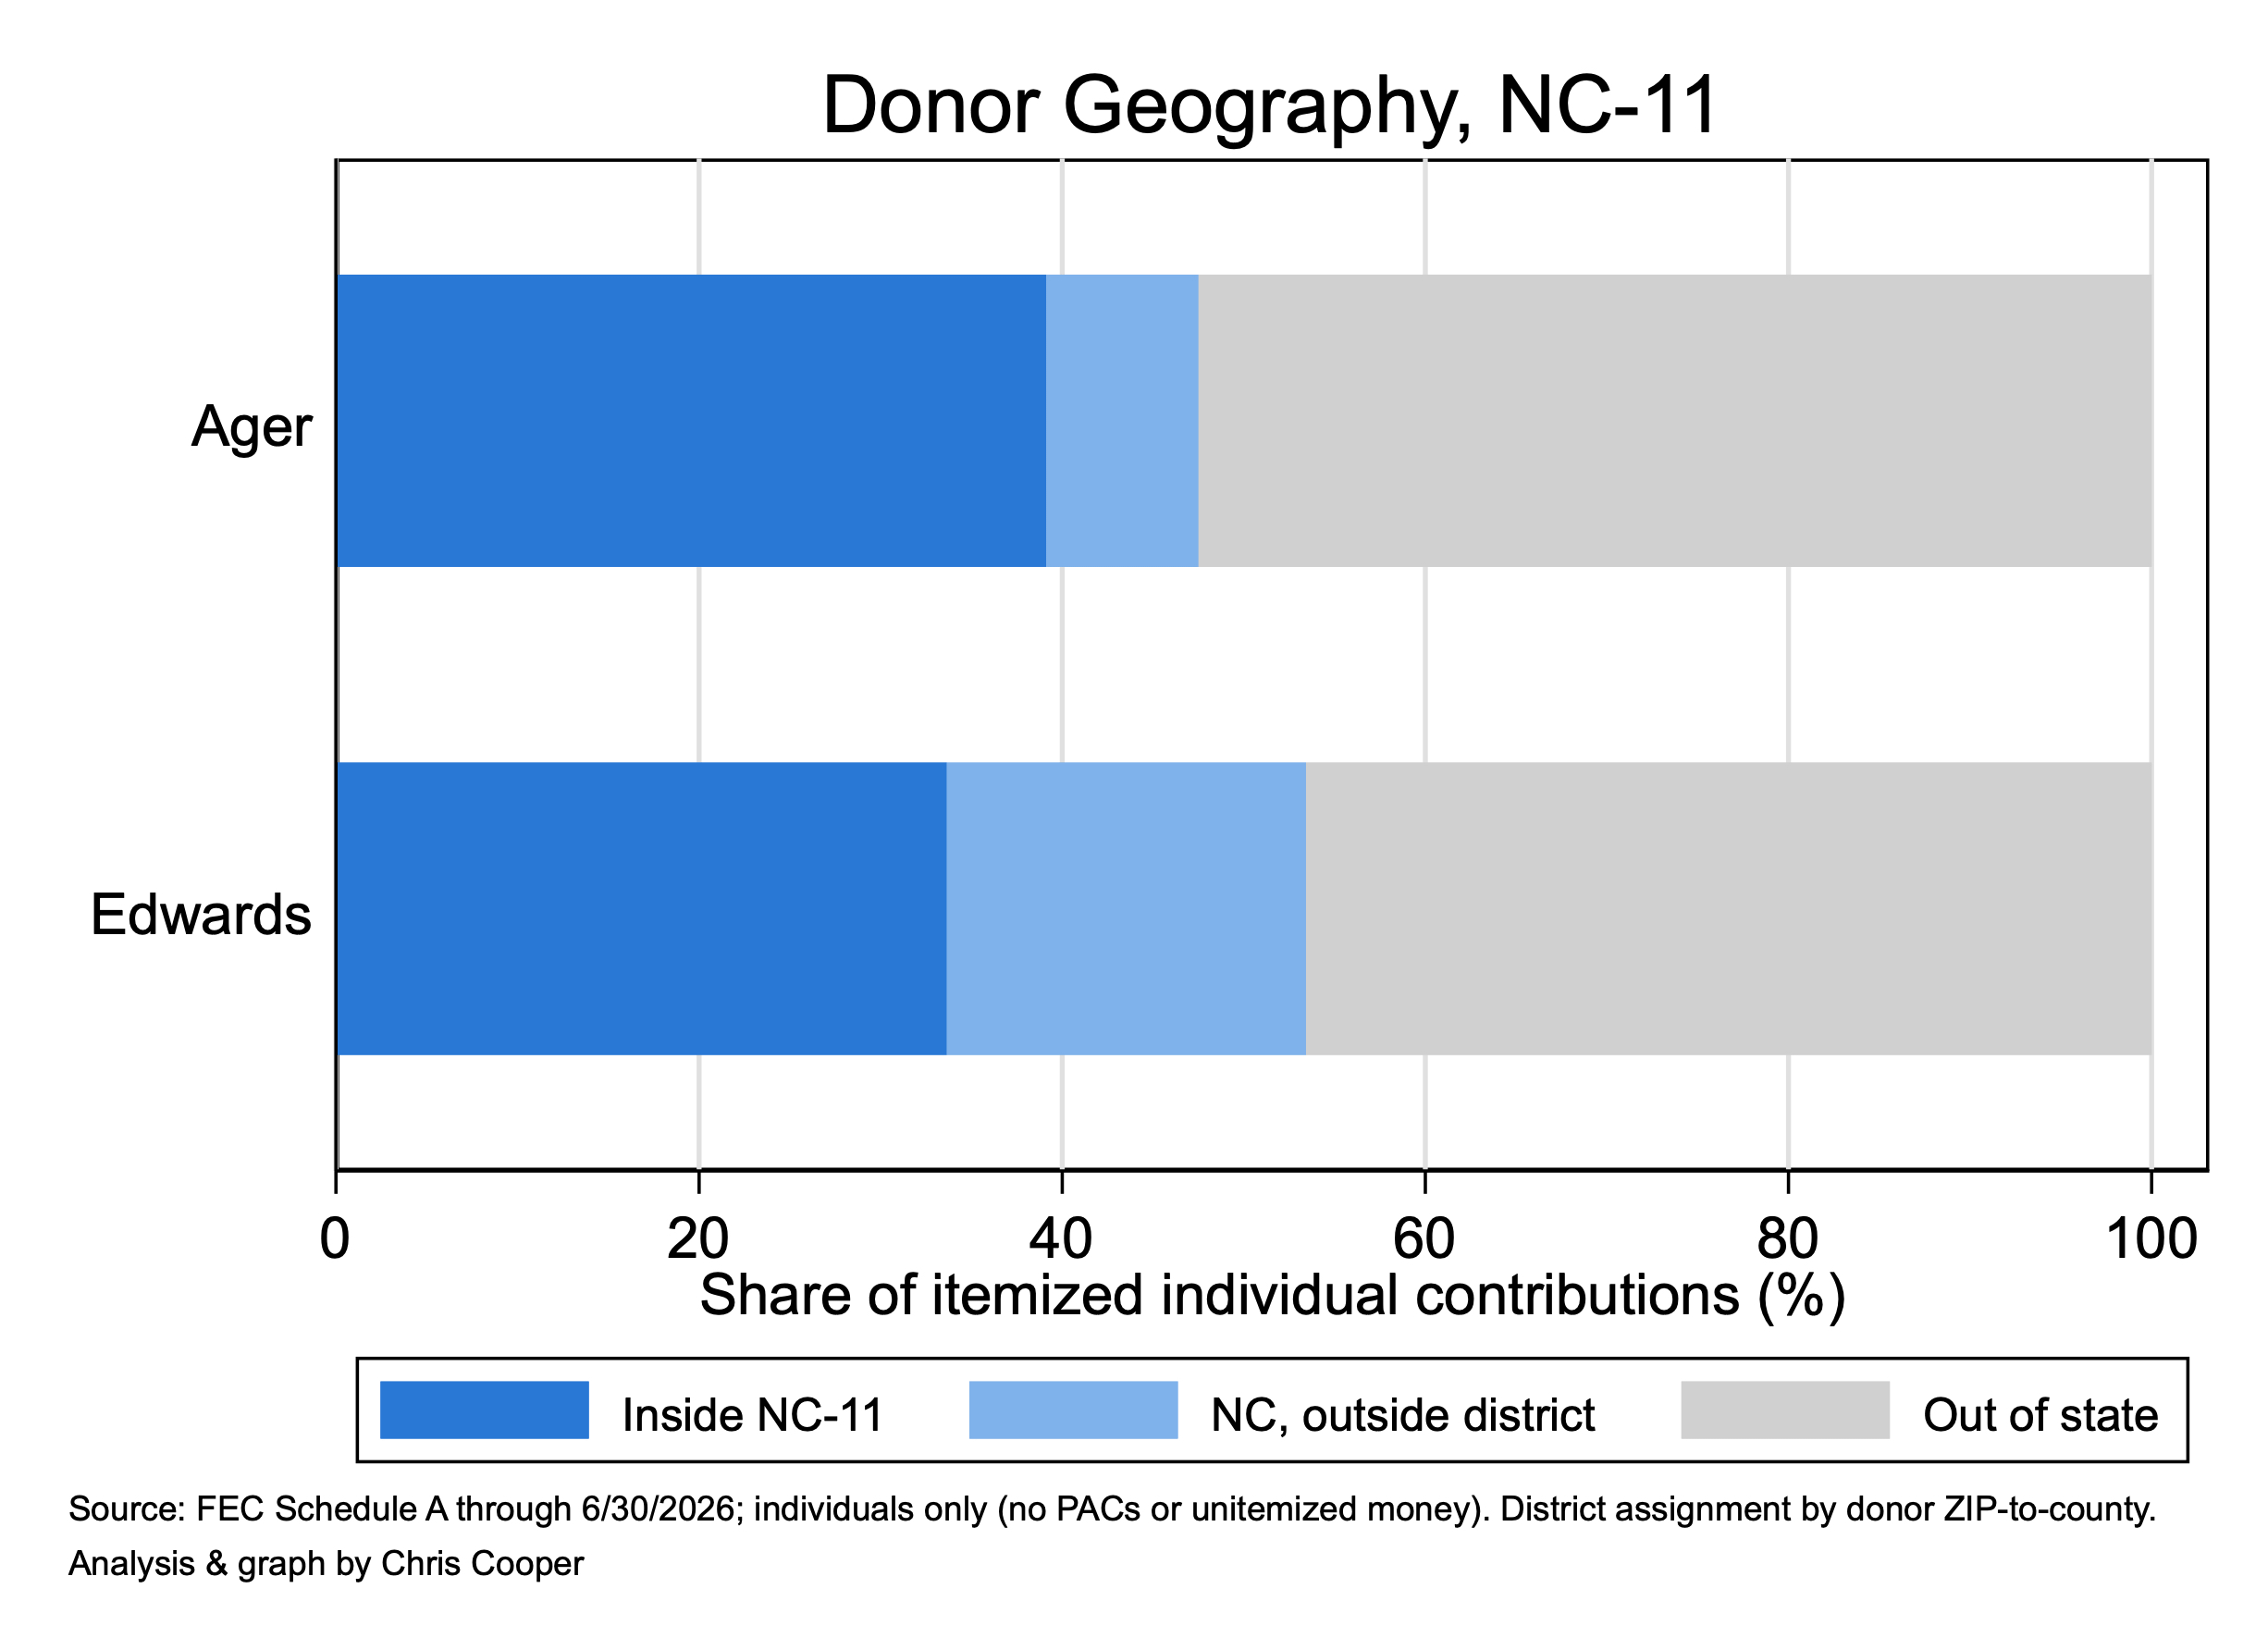
All money spends the same, but most candidates would prefer to have a larger share of their money from within the district. And after that, from within the state, but outside of the district.
Graph 3 shows that a slightly greater proportion of Ager’s itemized individual contributions comes from within the district. At the same time, Ager also gets a larger proportion of his itemized individual contributions from out of state—likely a result of his inclusion on the DCCC’s “Red to Blue” list, which acts as a bat signal to donors across the country.
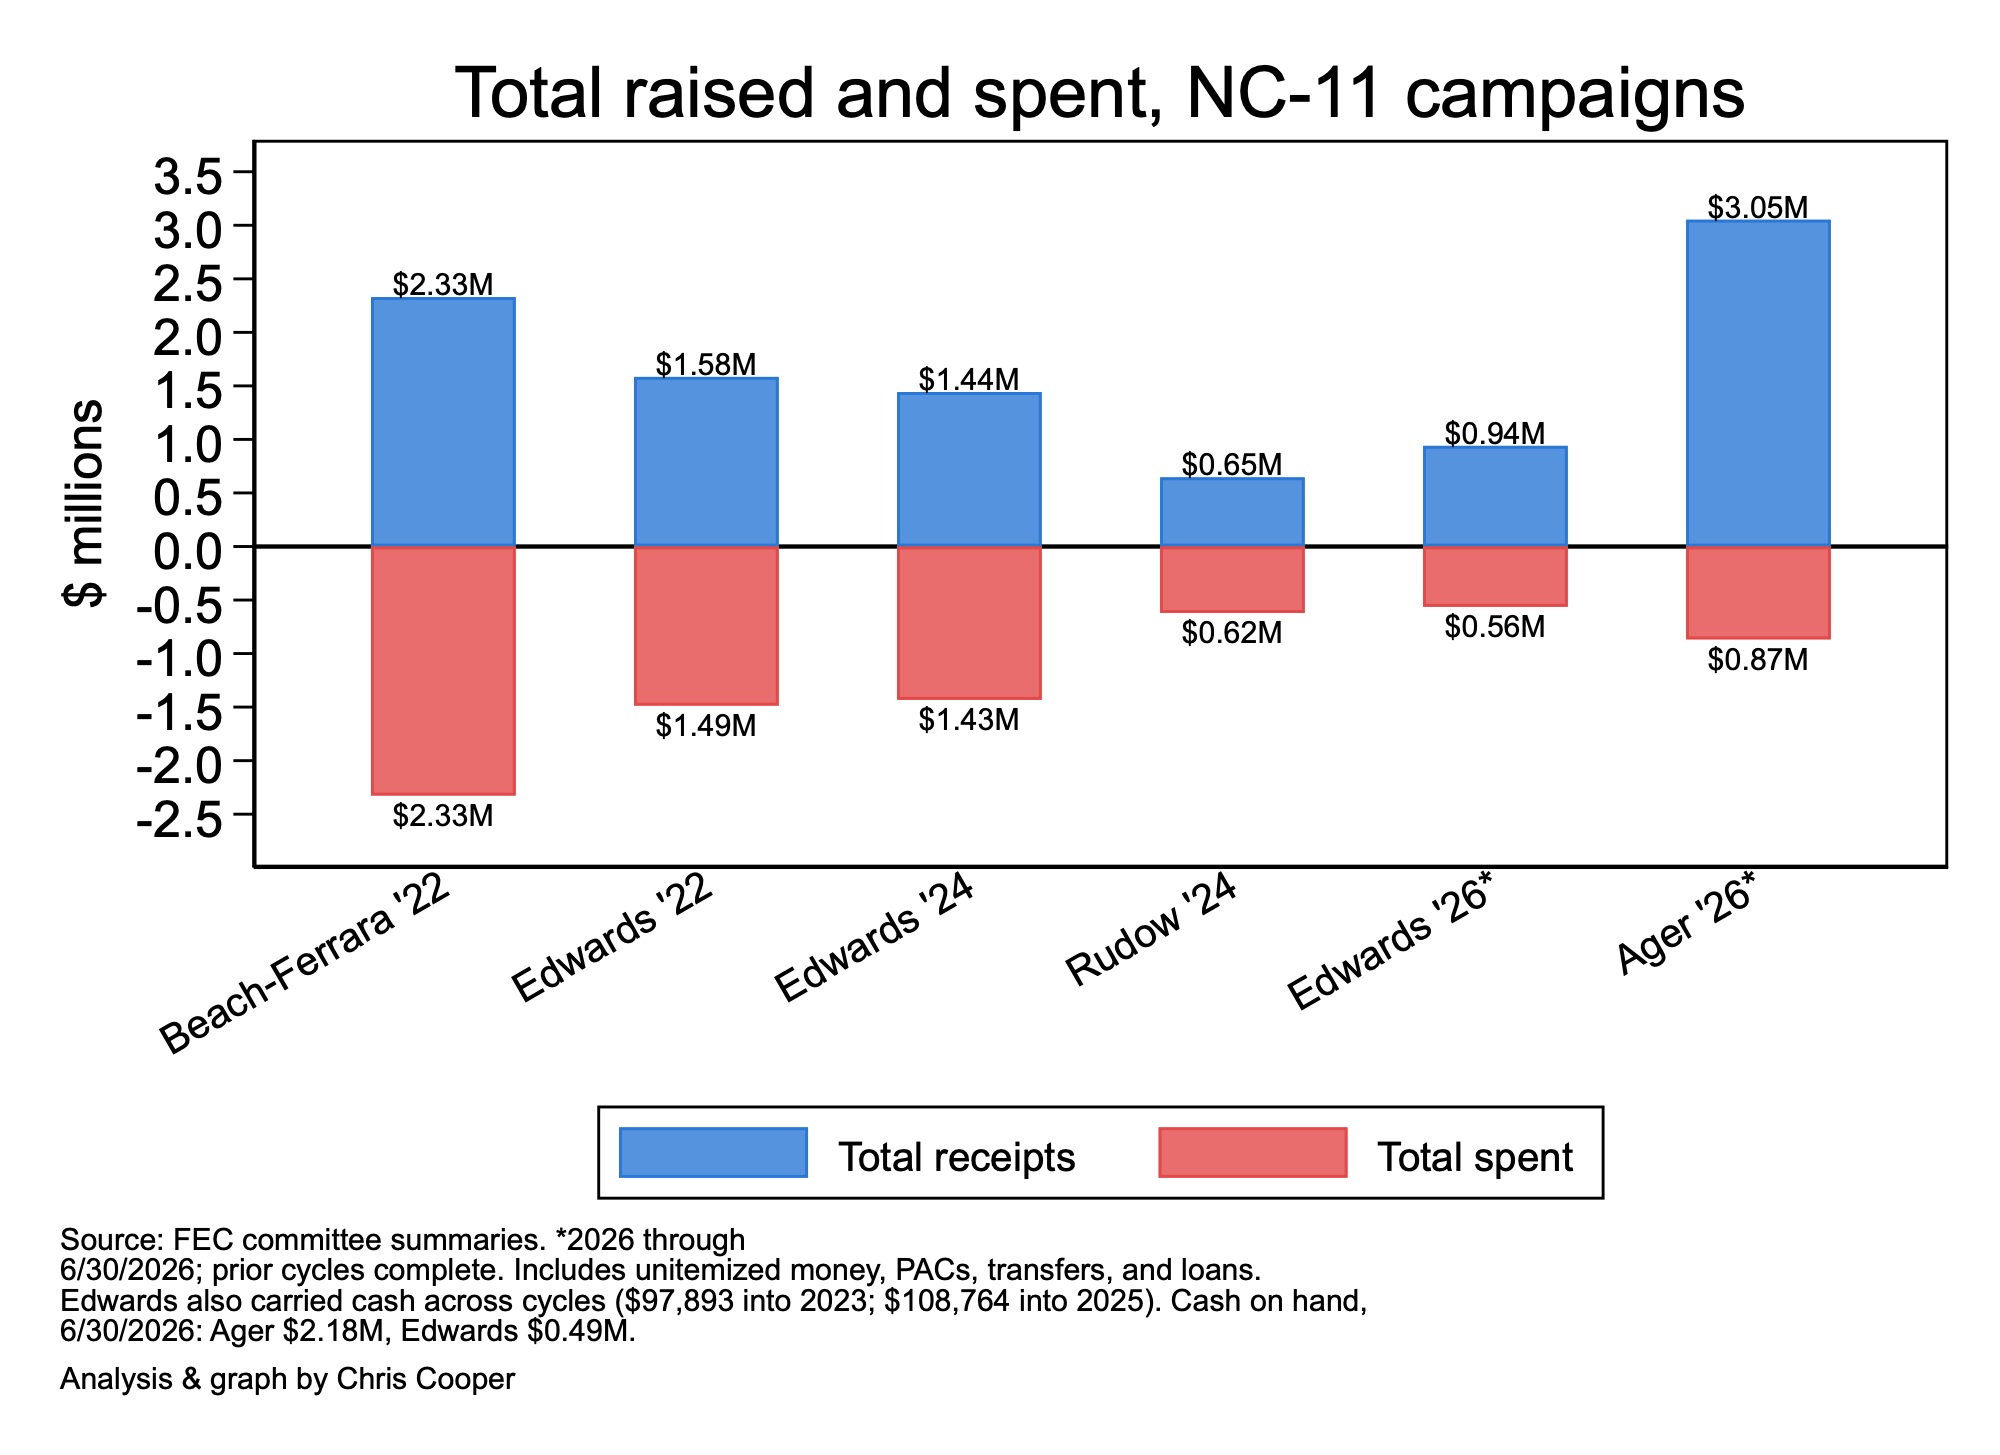
Graph 4. Total Raised and Spent on NC-11 Campaigns, 2022-2026
The graphs above make it clear that Ager is outraising Edwards thus far, but how do these numbers compare to previous elections? The next two graphs compare their fundraising numbers to NC-11 candidates in 2022 and 2024.
As the graph below shows, Ager is not only running far ahead of Edwards in 2026, but he has raised more than any of the four previous campaigns raised through Election Day—Jasmine Beach-Ferrara and Chuck Edwards in 2022, and Caleb Rudow and Chuck Edwards in 2024.
Graph 5. Itemized Fundraising by Cycle, 2022-2026
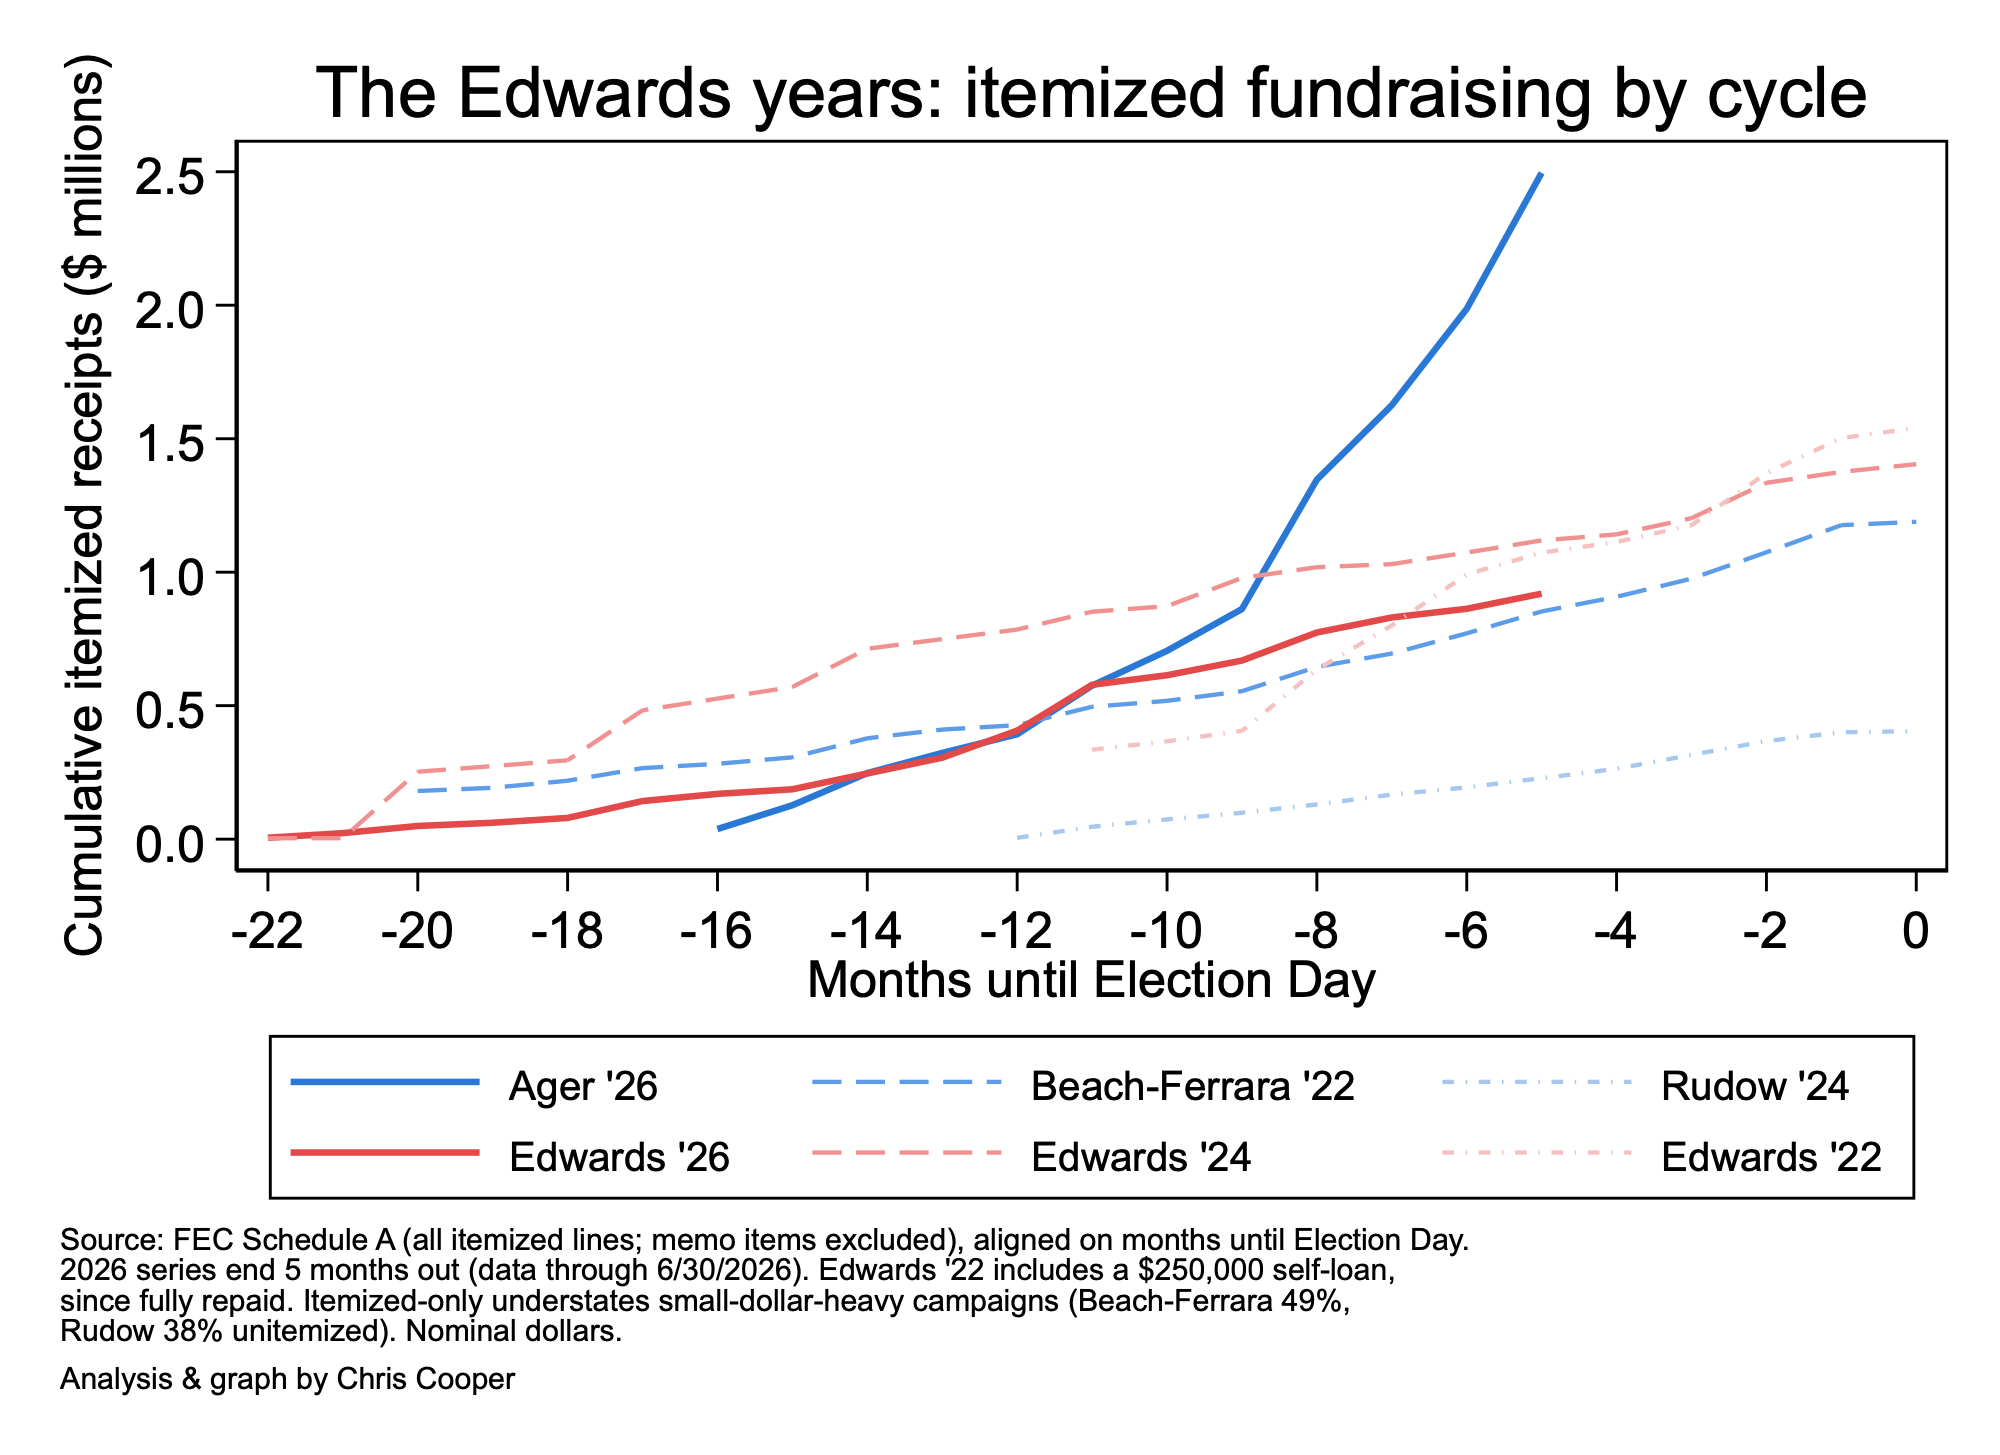
The final graph shows the cumulative amount of money NC-11 candidates from 2022 to the present have raised through itemized receipts (receipts reported individually in FEC filings, including individual contributions, PAC money, and transfers). It contains perhaps the worst news for Chuck Edwards.
Not only is Jamie Ager raising far more than every other NC-11 candidate across the last three election cycles,5 but Chuck Edwards’ itemized fundraising up to this point in the cycle trails his fundraising in 2022 and 2024—years when the district was much less competitive.6
What This Does (and Doesn’t) Mean
None of this is good news for Chuck Edwards.
By nearly every metric—total receipts, comparisons with previous campaigns, and itemized receipts at this point in the cycle—Jamie Ager is outraising the previous Democratic challengers as well as Chuck Edwards himself. Further, Chuck Edwards is currently raising less in total itemized receipts than he did at this point in 2022 and 2024—despite the fact that 2026 is expected to be more competitive than either of those elections.7
So, the problems for Edwards run in both directions—Ager fundraising overperformance and Edwards fundraising underperformance.
This does not mean Chuck Edwards will lose—the person with the most money does not always win, and the district has a consistent voting record in favor of Republican candidates. Skeptics need to look no further than Graph 4, which contains its own cautionary tale—Jasmine Beach-Ferrara outraised Edwards in 2022 and still lost by nearly ten points.
But it does serve as a warning sign for Edwards and raises questions about whether the national GOP will increase attention on this district.
For now, Edwards remains a slight favorite in a race that has become much harder to dismiss.
That’s not the same as saying it’s a toss-up—the Cook Political Report and Sabato’s Crystal Ball both rate the 11th as Lean Republican. But in the land of the blind, the one-eyed man is king. And in a state without competitive districts, Lean Republican can look like a barnburner.
In this piece in Sabato’s Crystal Ball, I discussed the history and the political geography of the 11th as well as why Democrats are a little bit optimistic about this unlikely district.
Receipts and cash on hand are different numbers, so the numbers do not align with the height of the bar.
A few wonky (but important) notes here. Beach-Ferrara’s total in Graph 4 ($2.3 million) is much larger than what is suggested in Graph 5 ($1.2 million). Both are correct. Graph 5 counts only itemized receipts, and nearly half of Beach-Ferrara's money came in small unitemized donations that never appear in itemized data. The same is true, to a lesser degree, for Rudow (38% unitemized) and Ager (about 18%)—while almost none of Edwards' money is unitemized. If anything, then, Graph 5 understates Democratic fundraising.
Which coincides with the creation of the current district boundaries.
And his 2022 pace was ahead of today’s only because it included a $250,000 loan he made to his own campaign.
Competitive elections usually generate more contributions. There is one partial bright spot for Edwards. His contributions from individual donors are running ahead of his 2024 pace—his decline is concentrated in PAC money and transfers.