

After a nine-and-a-half-hour meeting, the North Carolina State Board of Elections approved the final 20 early voting plans for the November 2026 election.1
Social media is full of folks crowing about these plans—some applauding them and some decrying them. To cut through the noise a bit, I spent some time late last week and this weekend collecting and analyzing these data to try to understand what’s really in them.2
Here's what I found, organized around six questions I've seen come up.
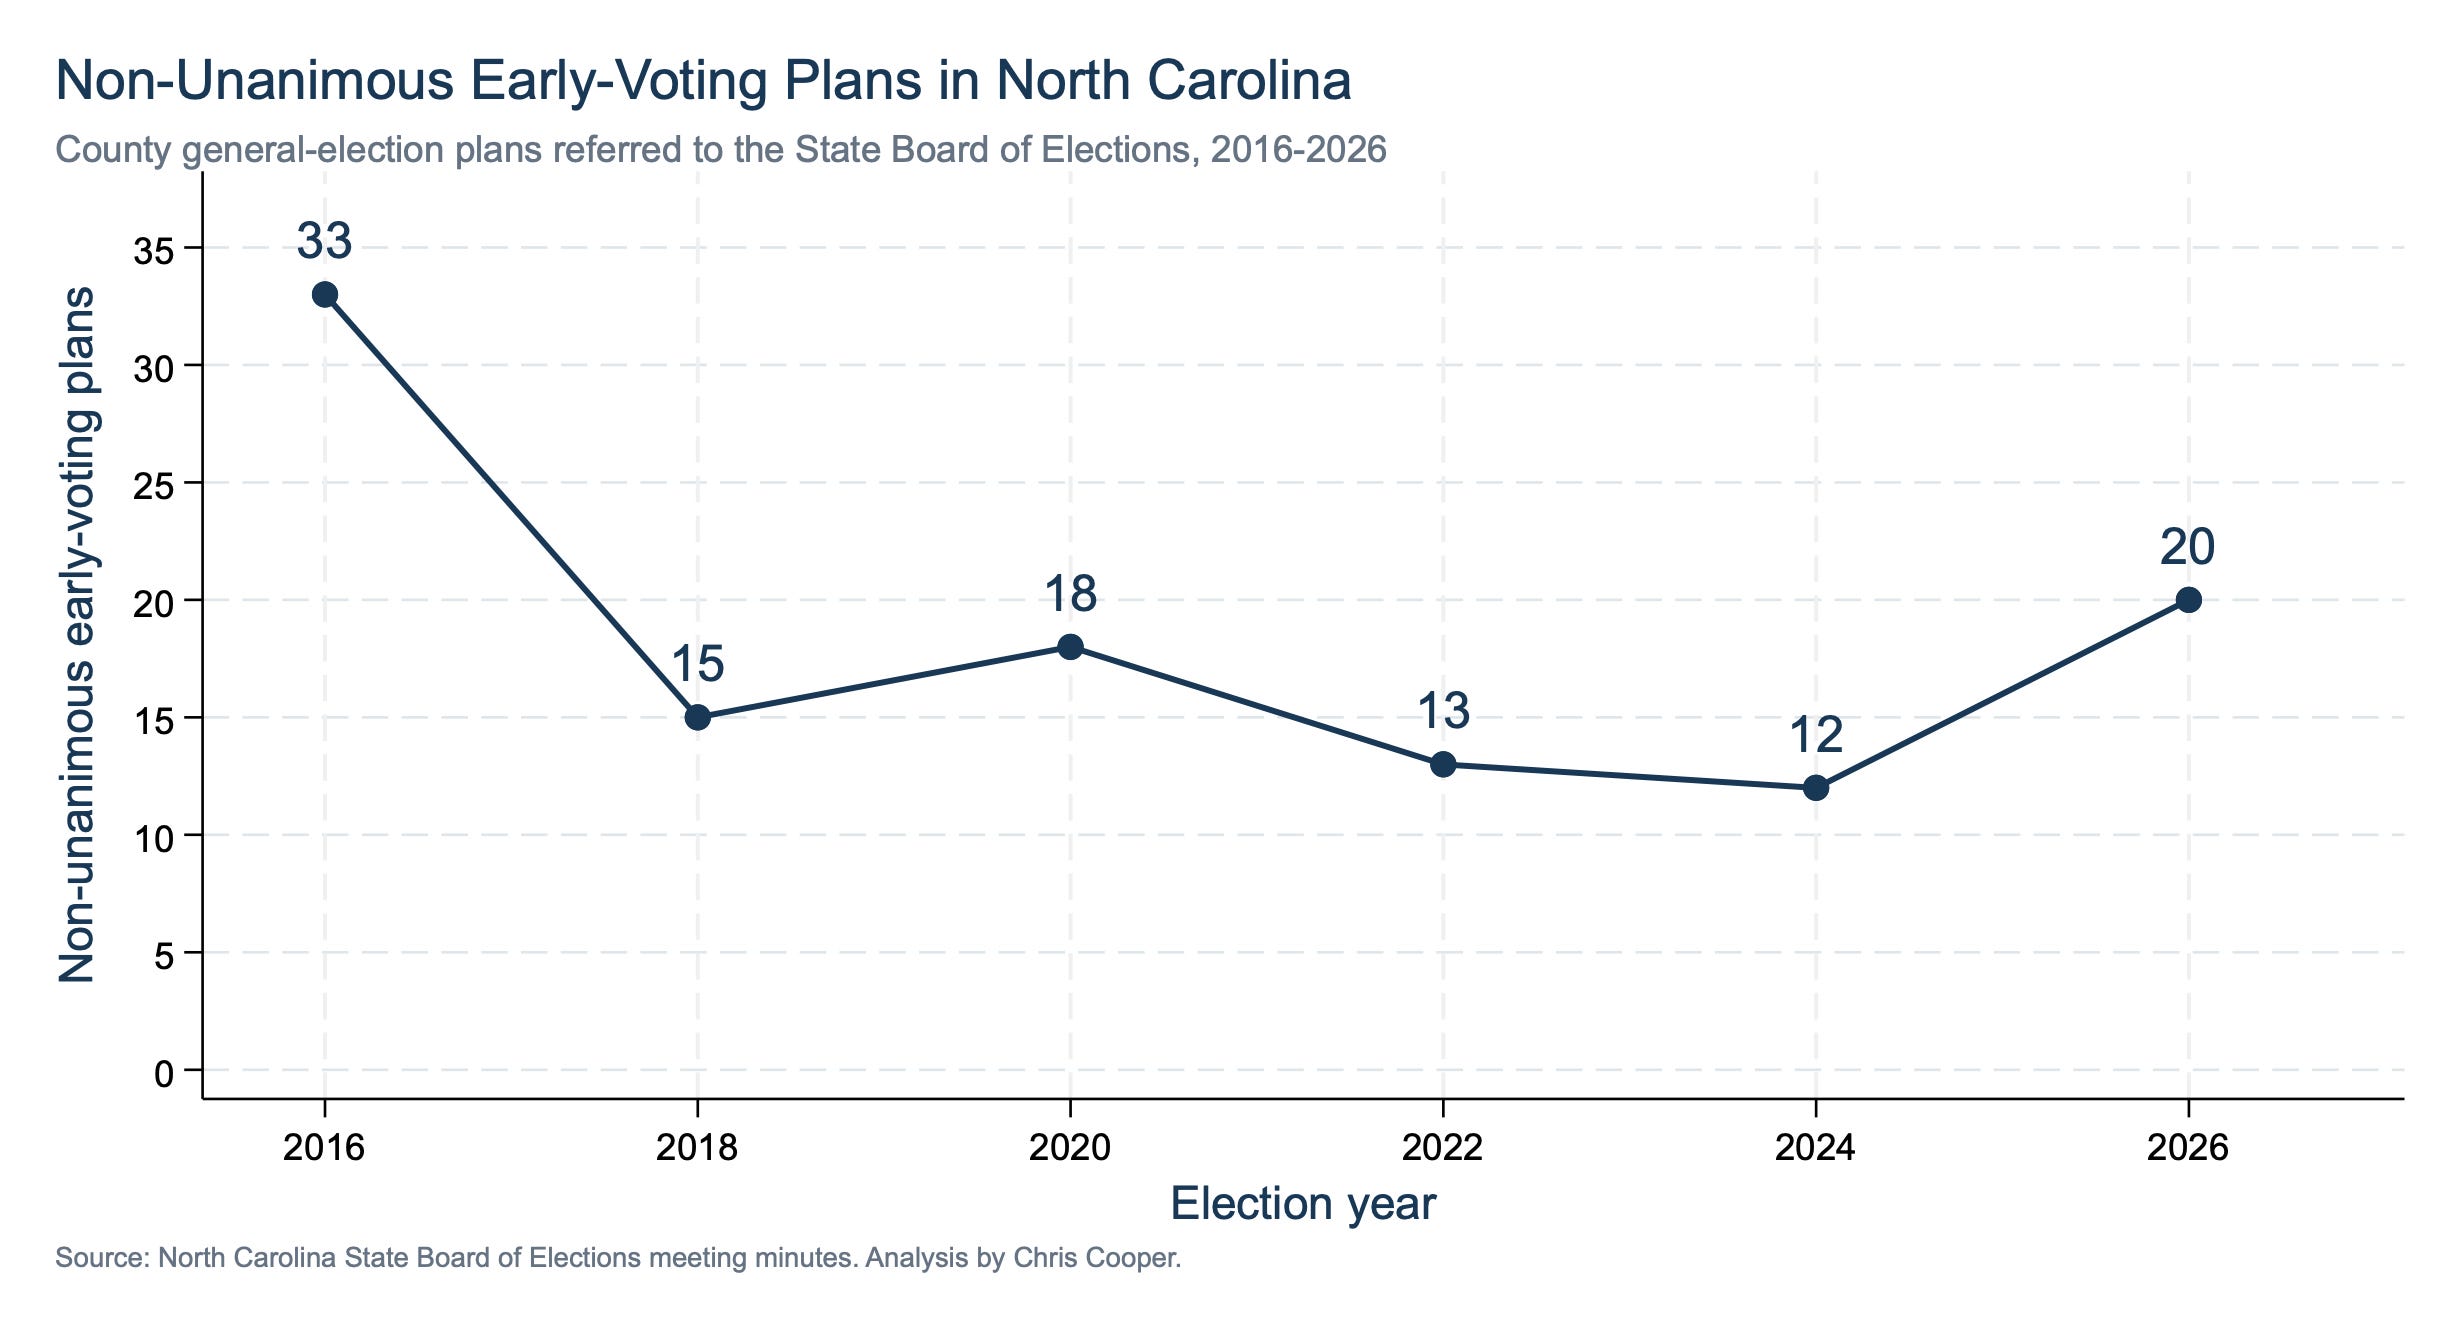
Did 2026 represent record disagreement? No, but it was high.
Some argued that the number of non-unanimous plans in 2026 was exceptionally high—a signal of dysfunction and partisanship sneaking into election administration. The data show a slightly murkier story.
2026 saw 20 non-unanimous plans—a number that is higher than in recent years. It is not a record, though. There were 33 (!) non-unanimous plans in 2016—the last year prior to 2026 when Republicans held majority control over the NCSBE.3
Which counties were most likely to have non-unanimous plans? Counties with more board turnover and more previous disagreement
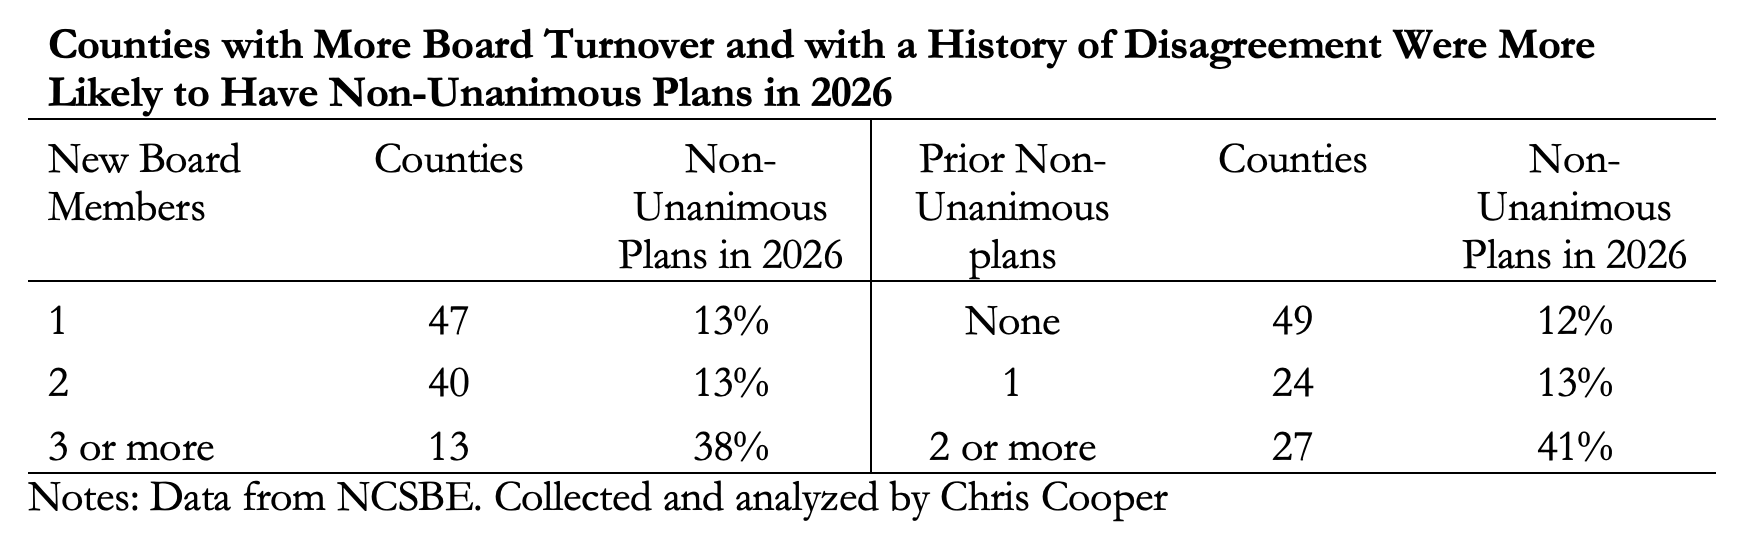
Two factors seem to explain why some county boards were more likely to disagree than others.
First, counties with fewer returning board members (i.e. more turnover) were more likely to disagree. Only 13 percent of counties with one new board member (the minimum possible) had a non-unanimous plan, while counties with three or more new board members were almost three times as likely to disagree. County boards are made up of people, and people who agreed once are more inclined to agree again—a history of compromise that new members don’t have yet.
There is also some evidence that some counties are just more disagreeable than others. About 41 percent of counties that had two or more prior non-unanimous plans (going back to 2016) had a non-unanimous plan in 2026, compared to just 12 percent of counties that had been in unanimous agreement over the same time period.4
Is there more access than ever before? Yes and no.
The graph below shows a simple count of the number of early voting sites in North Carolina from 2008 to 2026. As you can see from the green line, the 367 sites in 2026 essentially match (one site difference) the number in 2014—supporting the argument that midterm access is as good as it’s ever been.5
The graph also shows presidential election year sites (the top, blue line) and demonstrates, not surprisingly, that there are typically more presidential election year sites than midterm election sites. The reason is clear—there are more voters in presidential than midterm elections, so we need more sites.
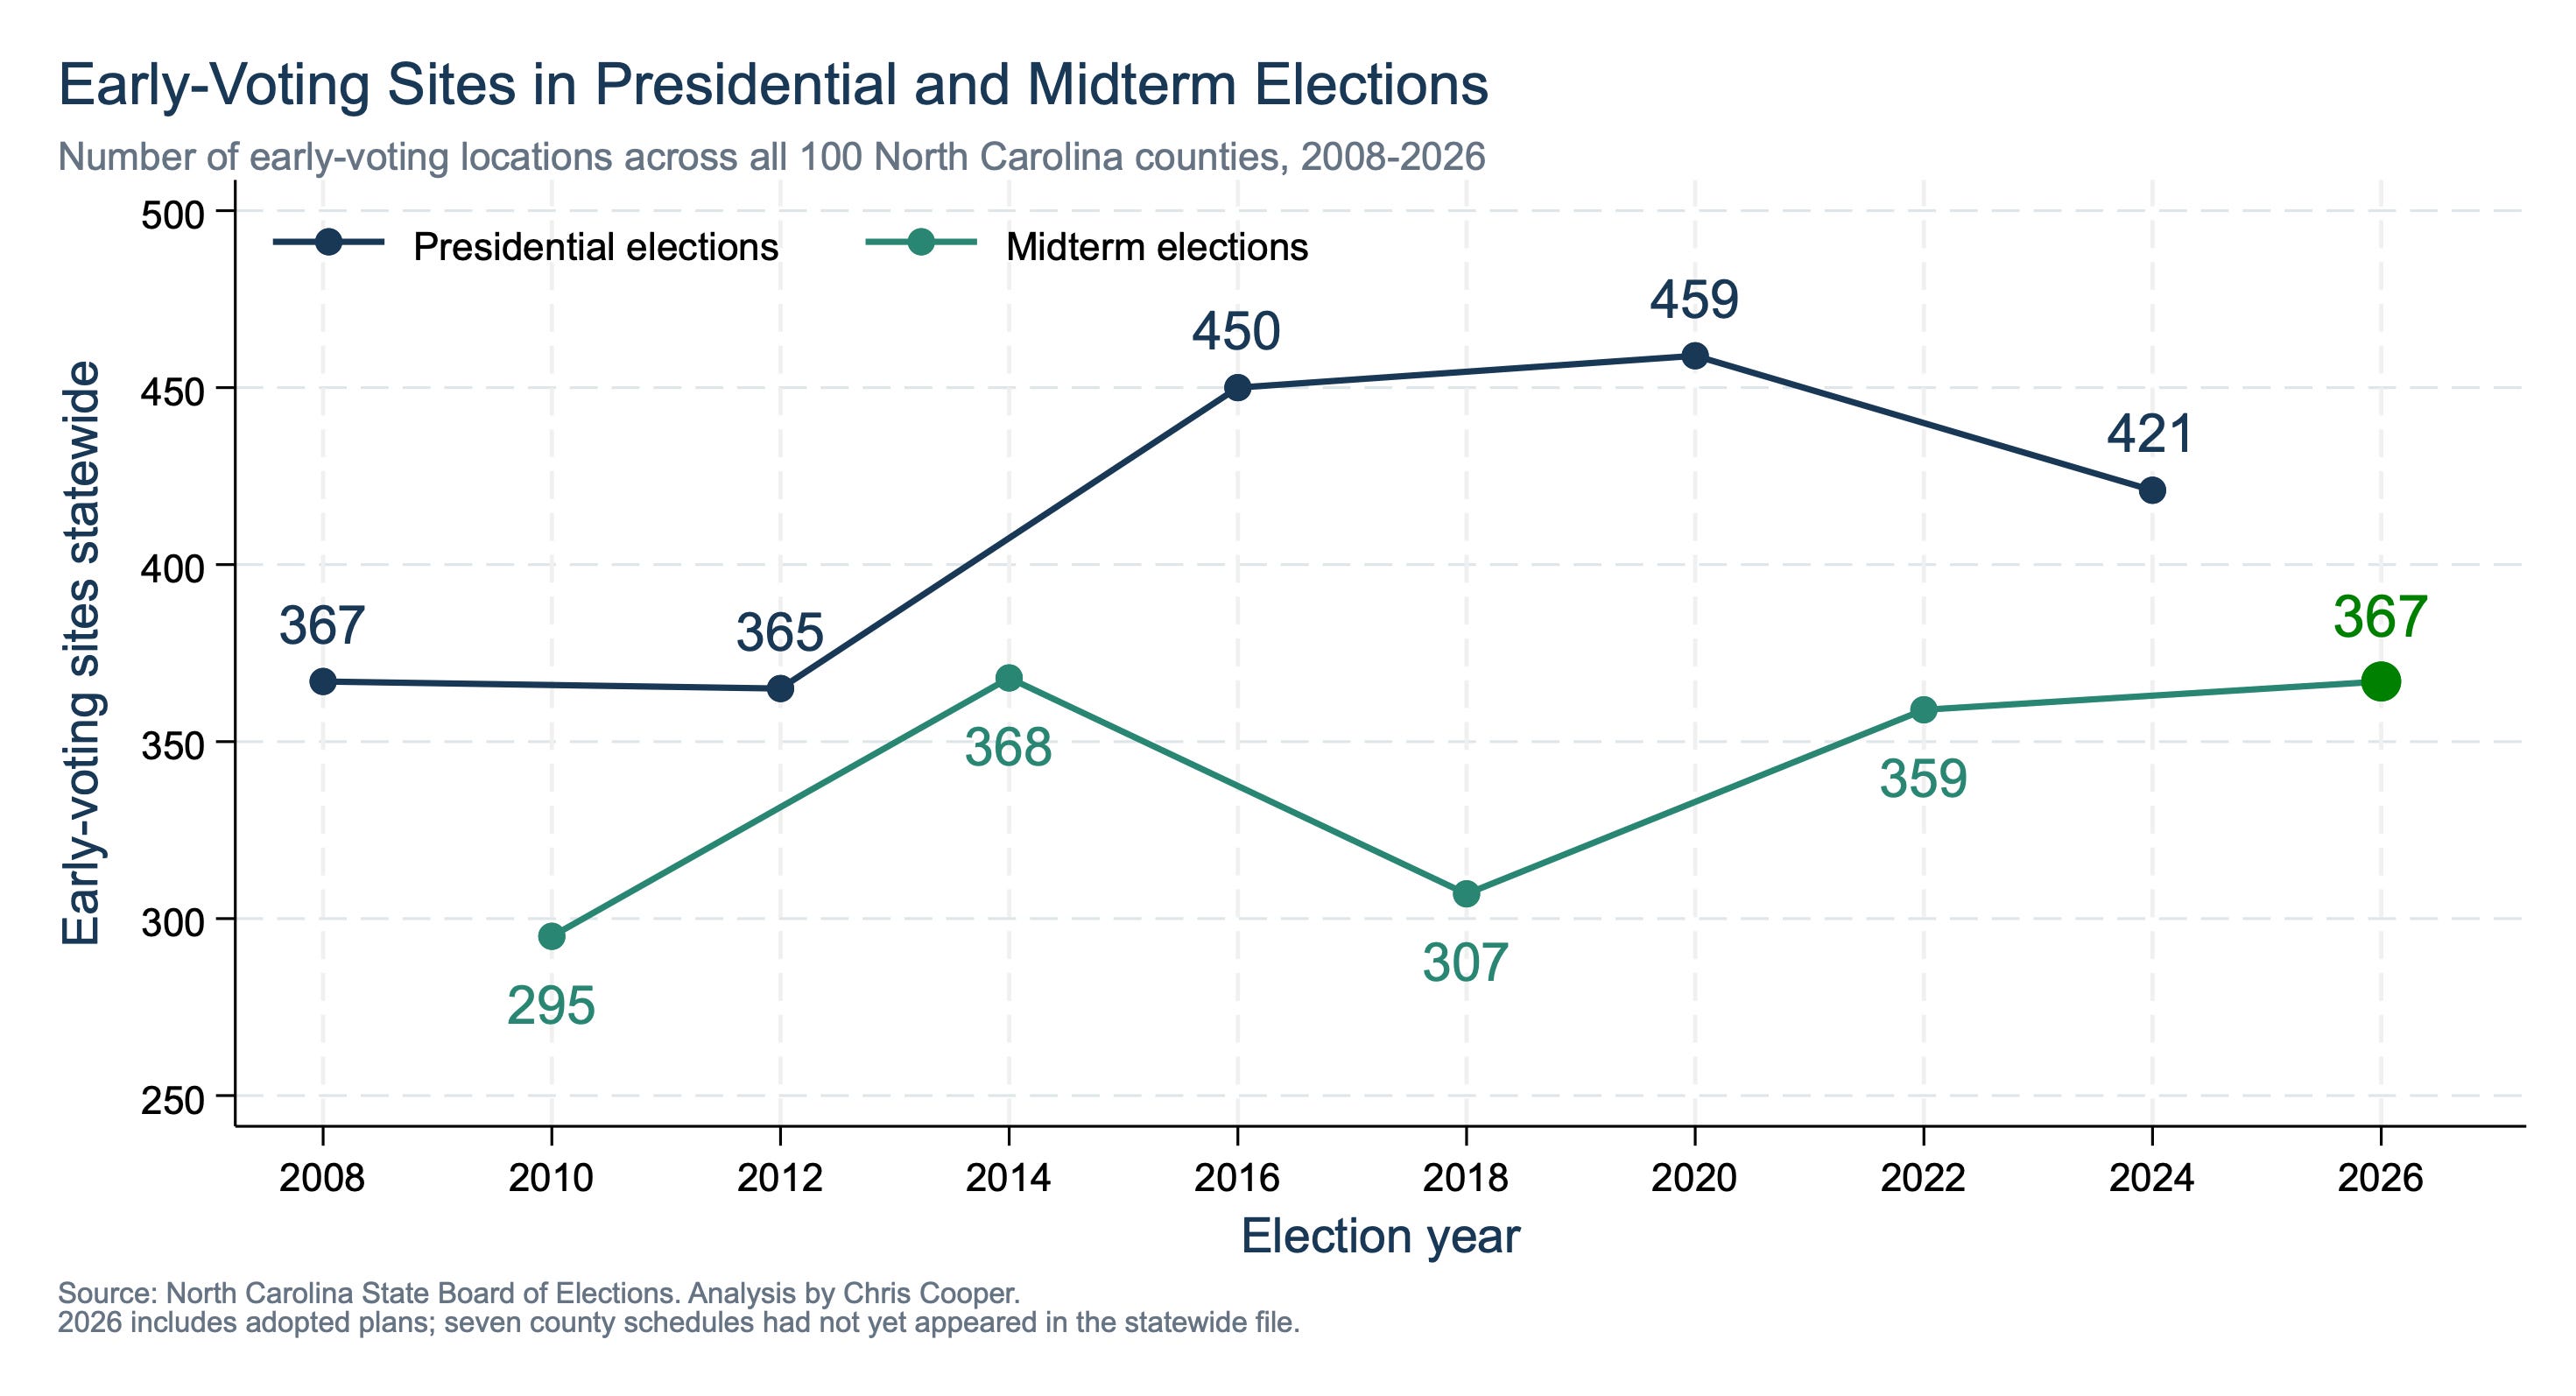
The 367 sites planned for 2026 are eight more than the 359 sites available in 2022. But that increase hides a related truth—more than one-quarter of the 2026 locations were not used in the previous midterm.6
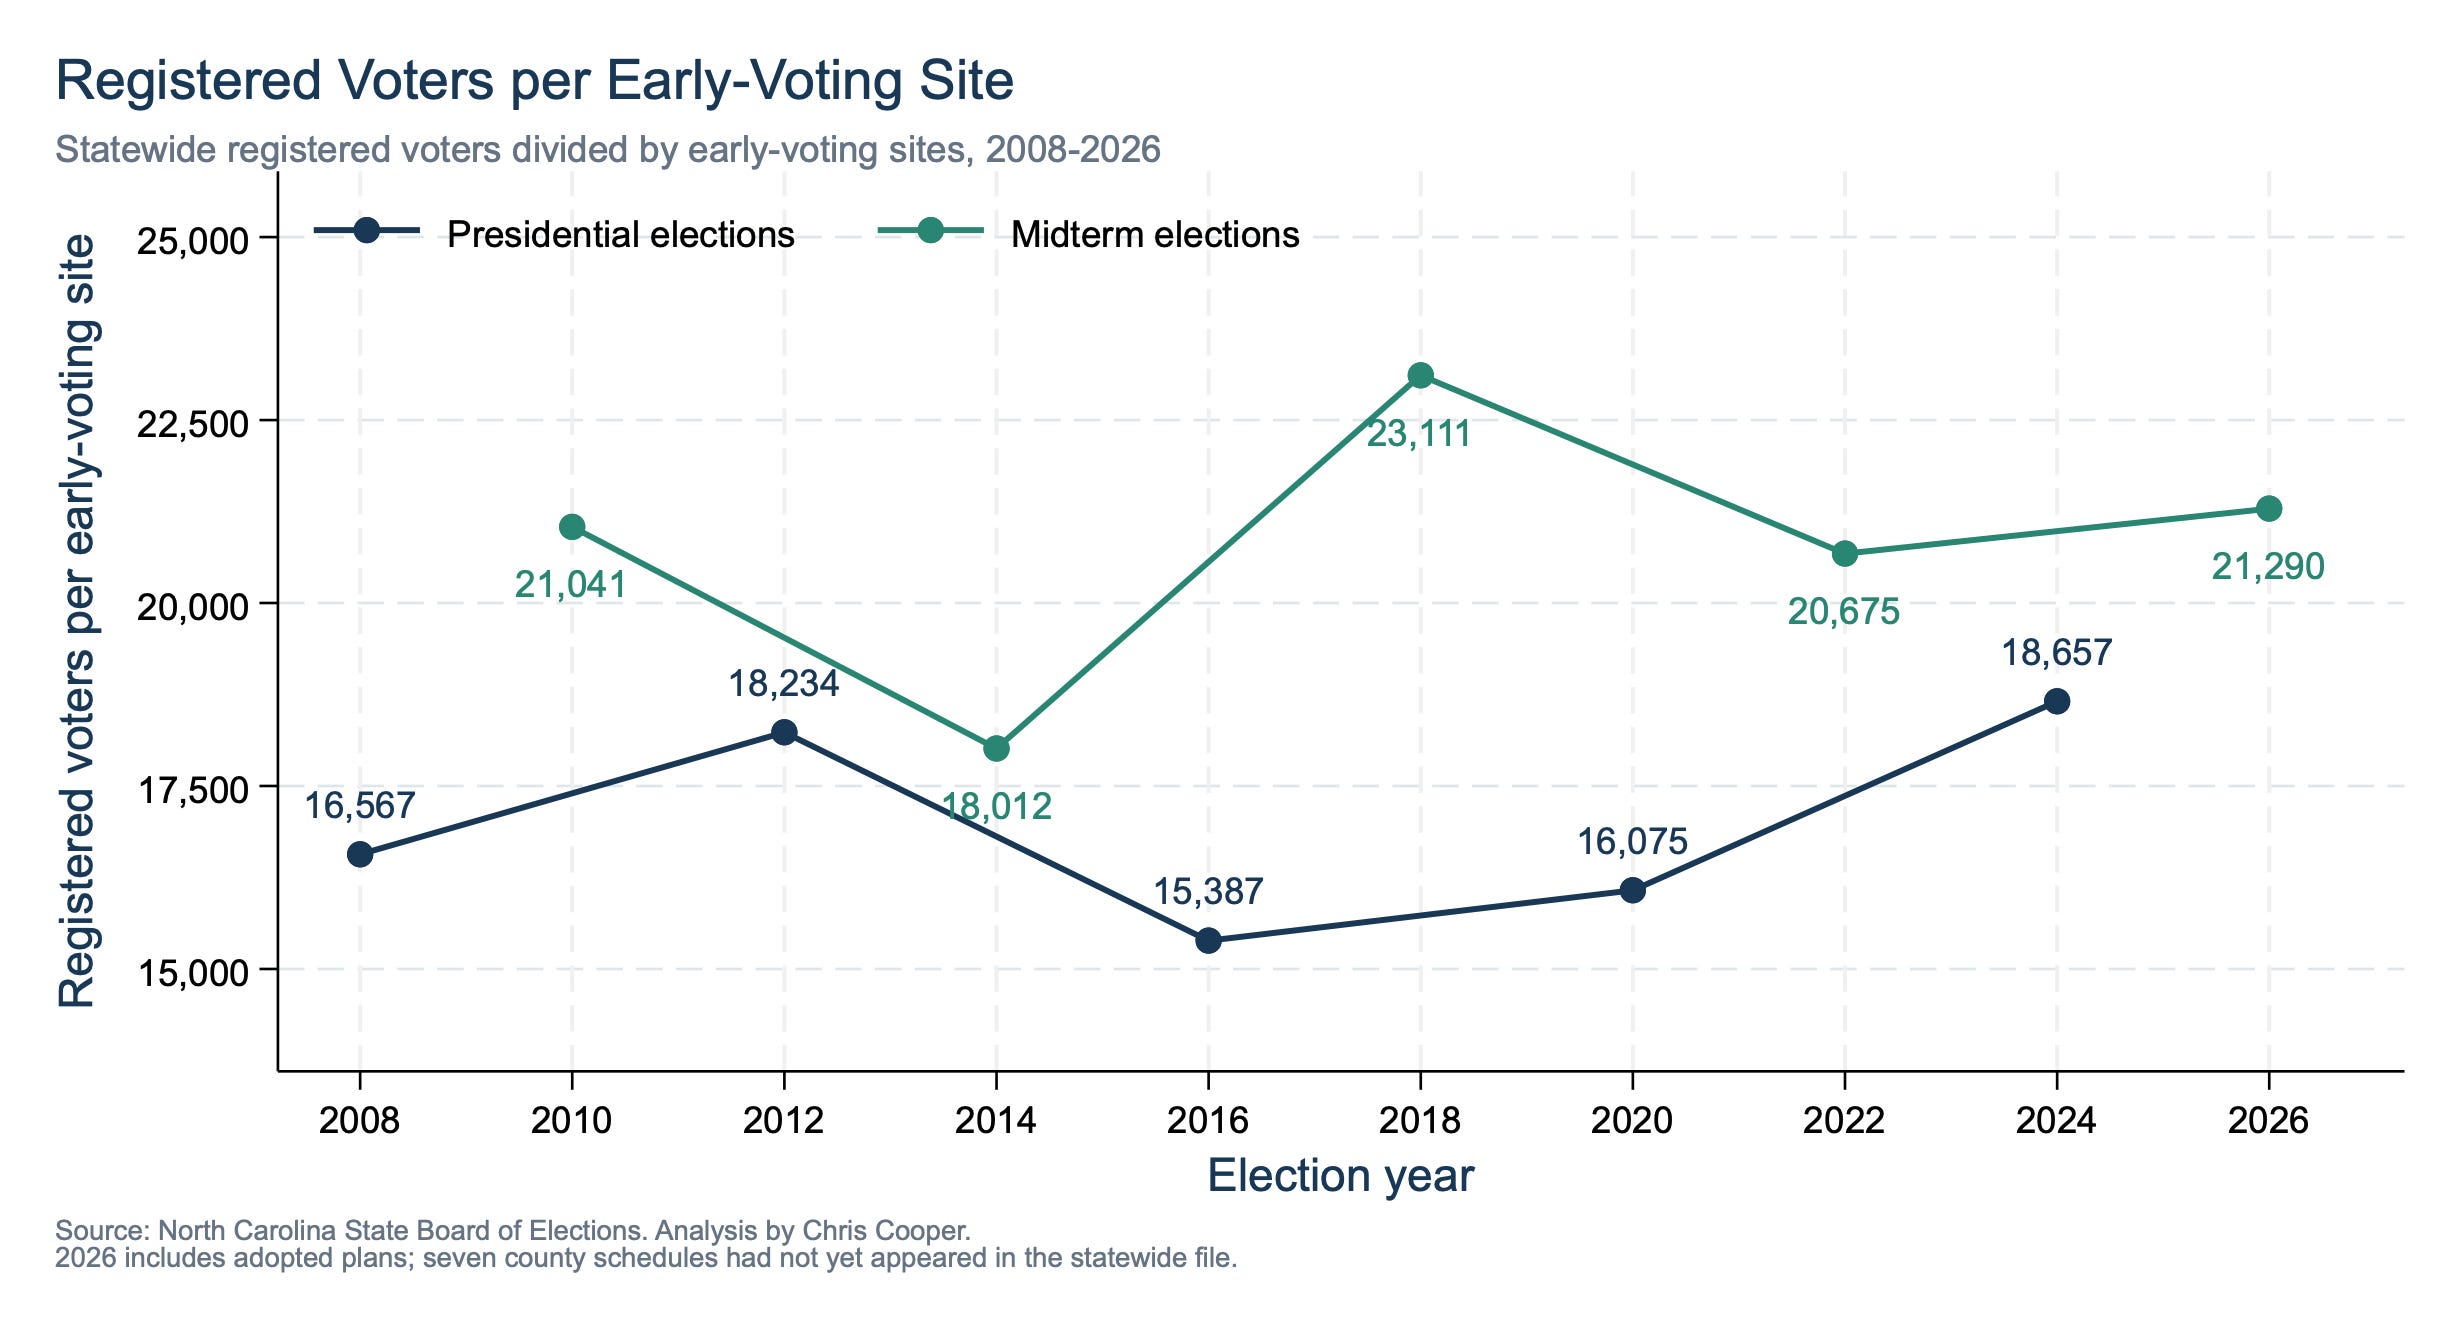
The number of sites only tells part of the story. Another measure of access is the number of registered voters per site. The state of North Carolina is growing, so maintaining access would imply that the number of sites should keep pace with the number of registered voters, rather than stay stagnant. The graph below showing the number of registered voters per early voting site is a bit counter-intuitive—higher numbers are worse (they represent less access). From this vantage point, access stayed roughly constant or perhaps got a little bit worse from 2022 to 2026.
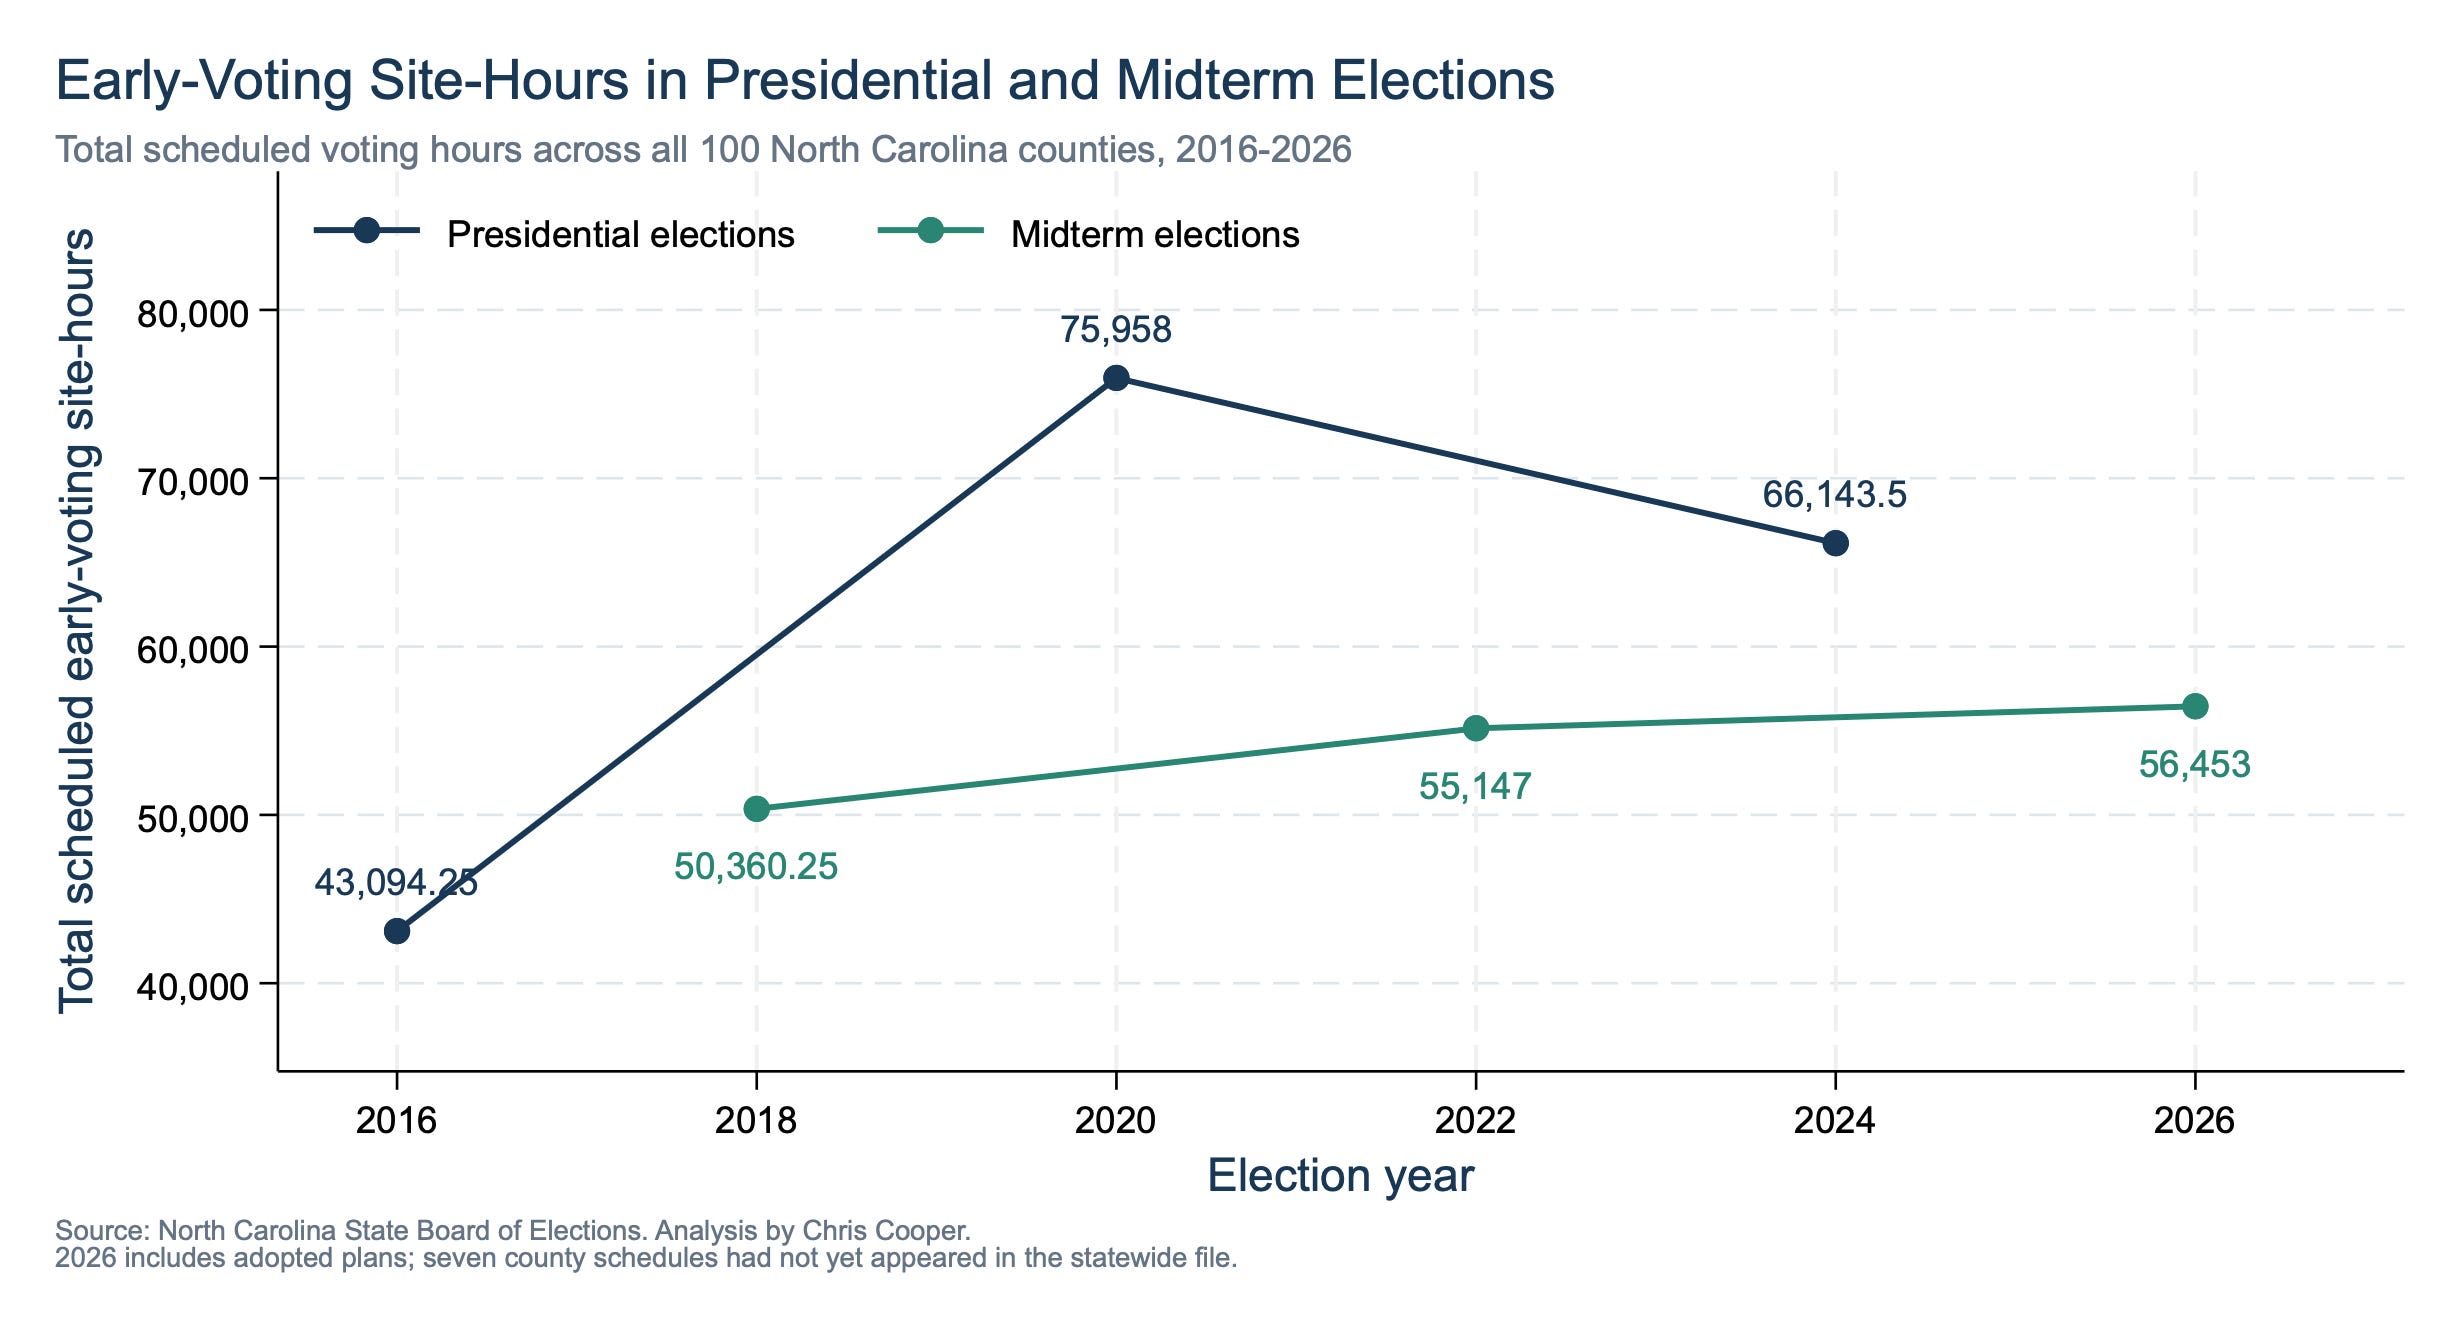
But even that metric isn’t perfect. After all, the above graph is agnostic as to whether a site is open for one hour or for 68 hours—presumably the 68-hour site would have greater access. So, next, I computed total site-hours—the combined number of hours that all early voting sites are open. Total site-hours increased about 2.4 percent from 2022 to 2026, supporting the narrative that 2026 will bring additional access.
It’s worth noting, though, that the number of registered voters increased more than twice as quickly—5.3 percent—over the same period.
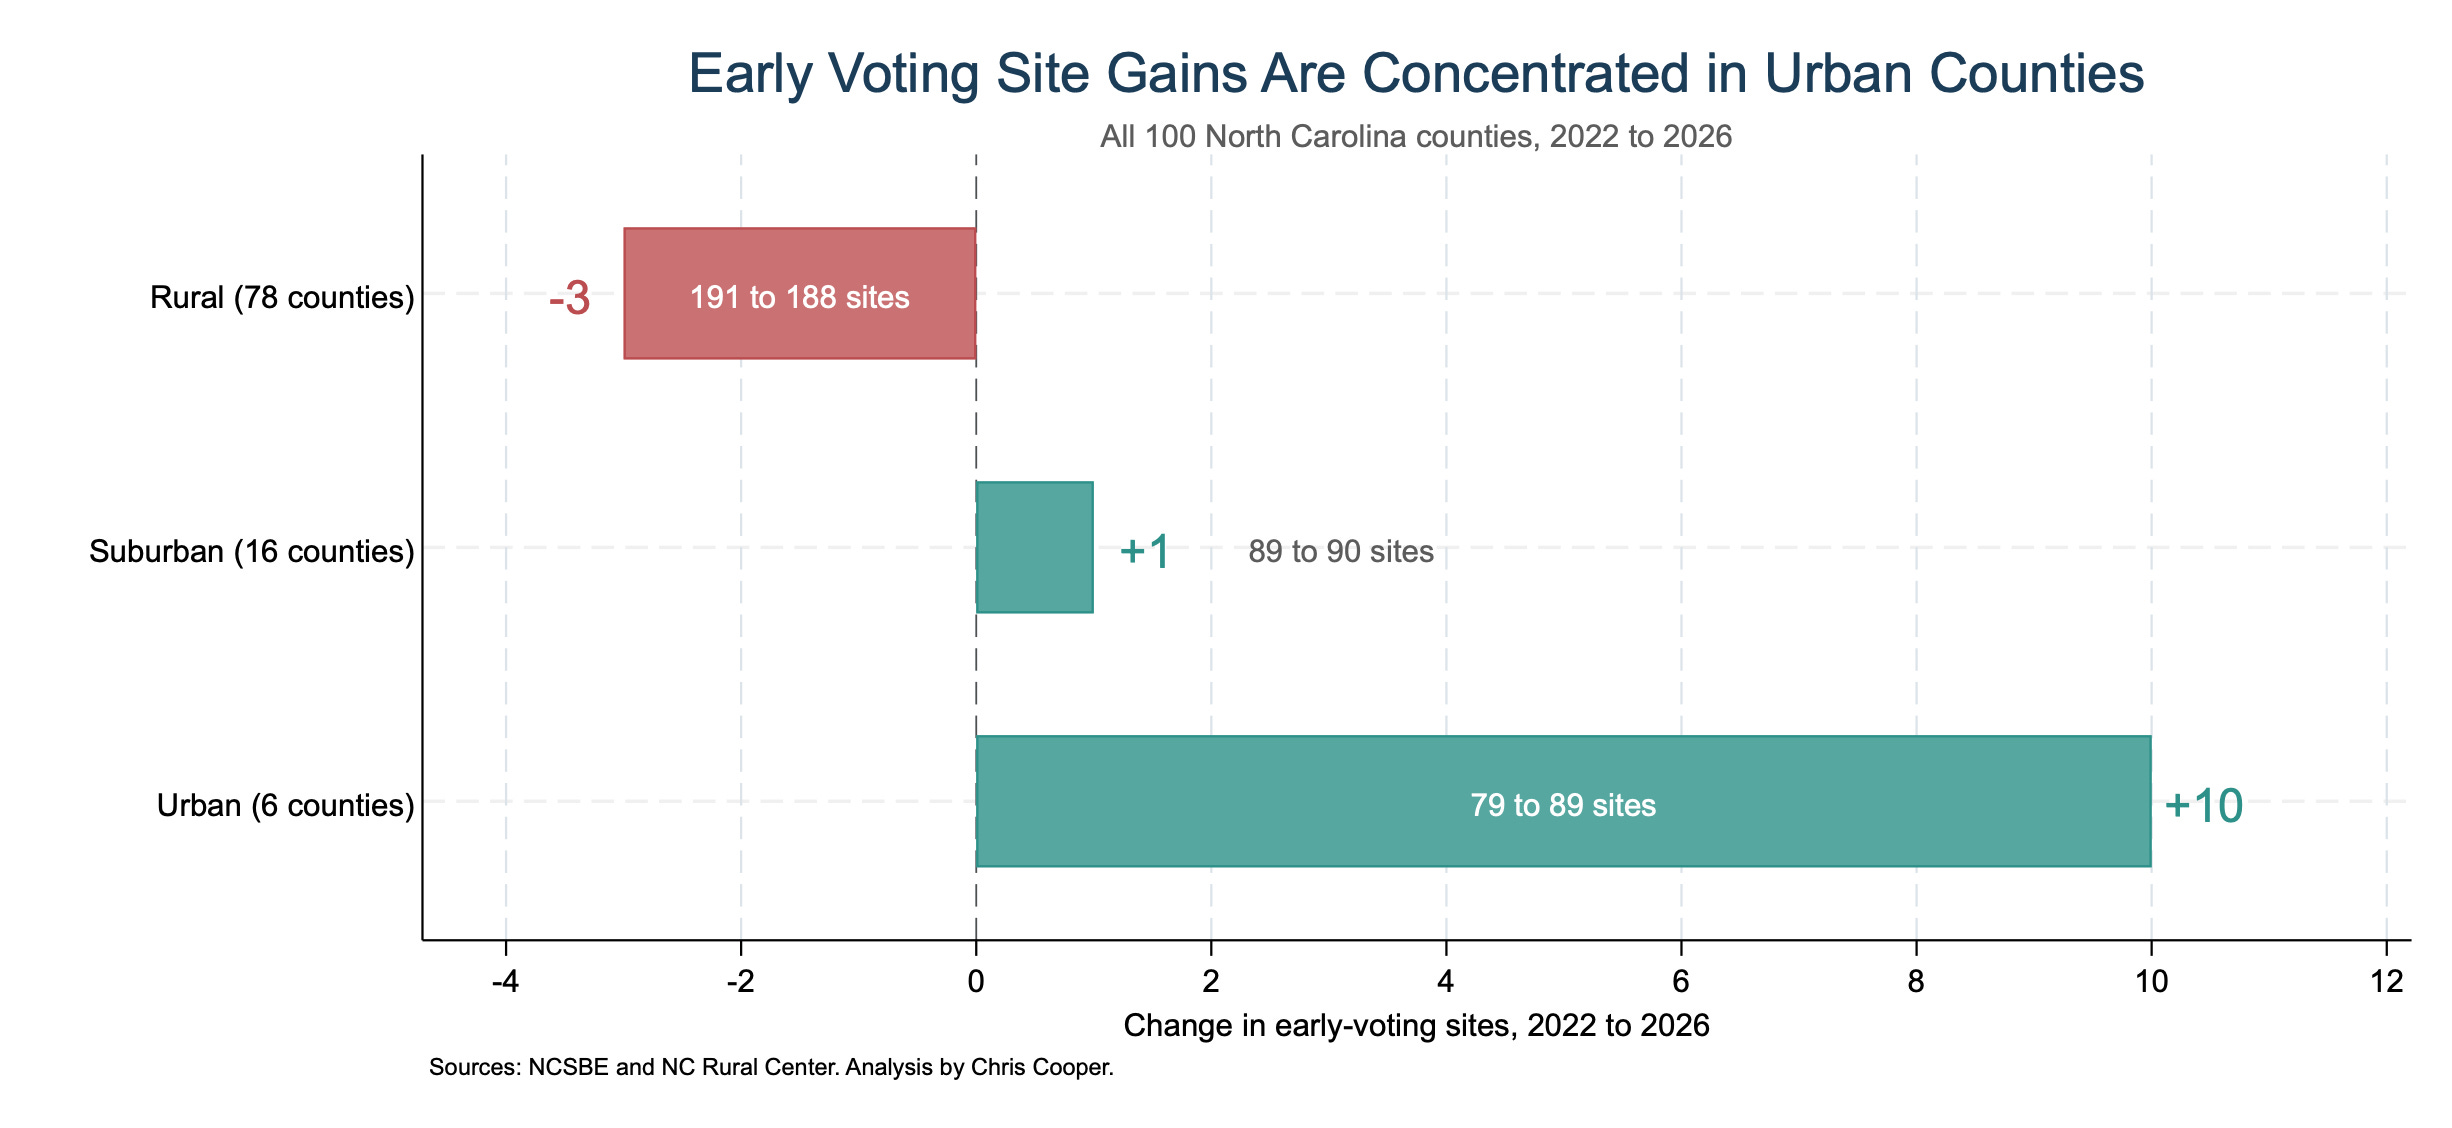
Where Are The Increases? Mostly in Urban Counties
Of course, the site changes aren’t equally distributed. As the figure below shows, the decreases tend to fall in rural counties while the increases tend to come in urban counties—consistent with population growth. It’s notable that, on average, this would seem to run counter to Republican partisan interests (as Republicans tend to do better in rural counties and Democrats in urban counties).
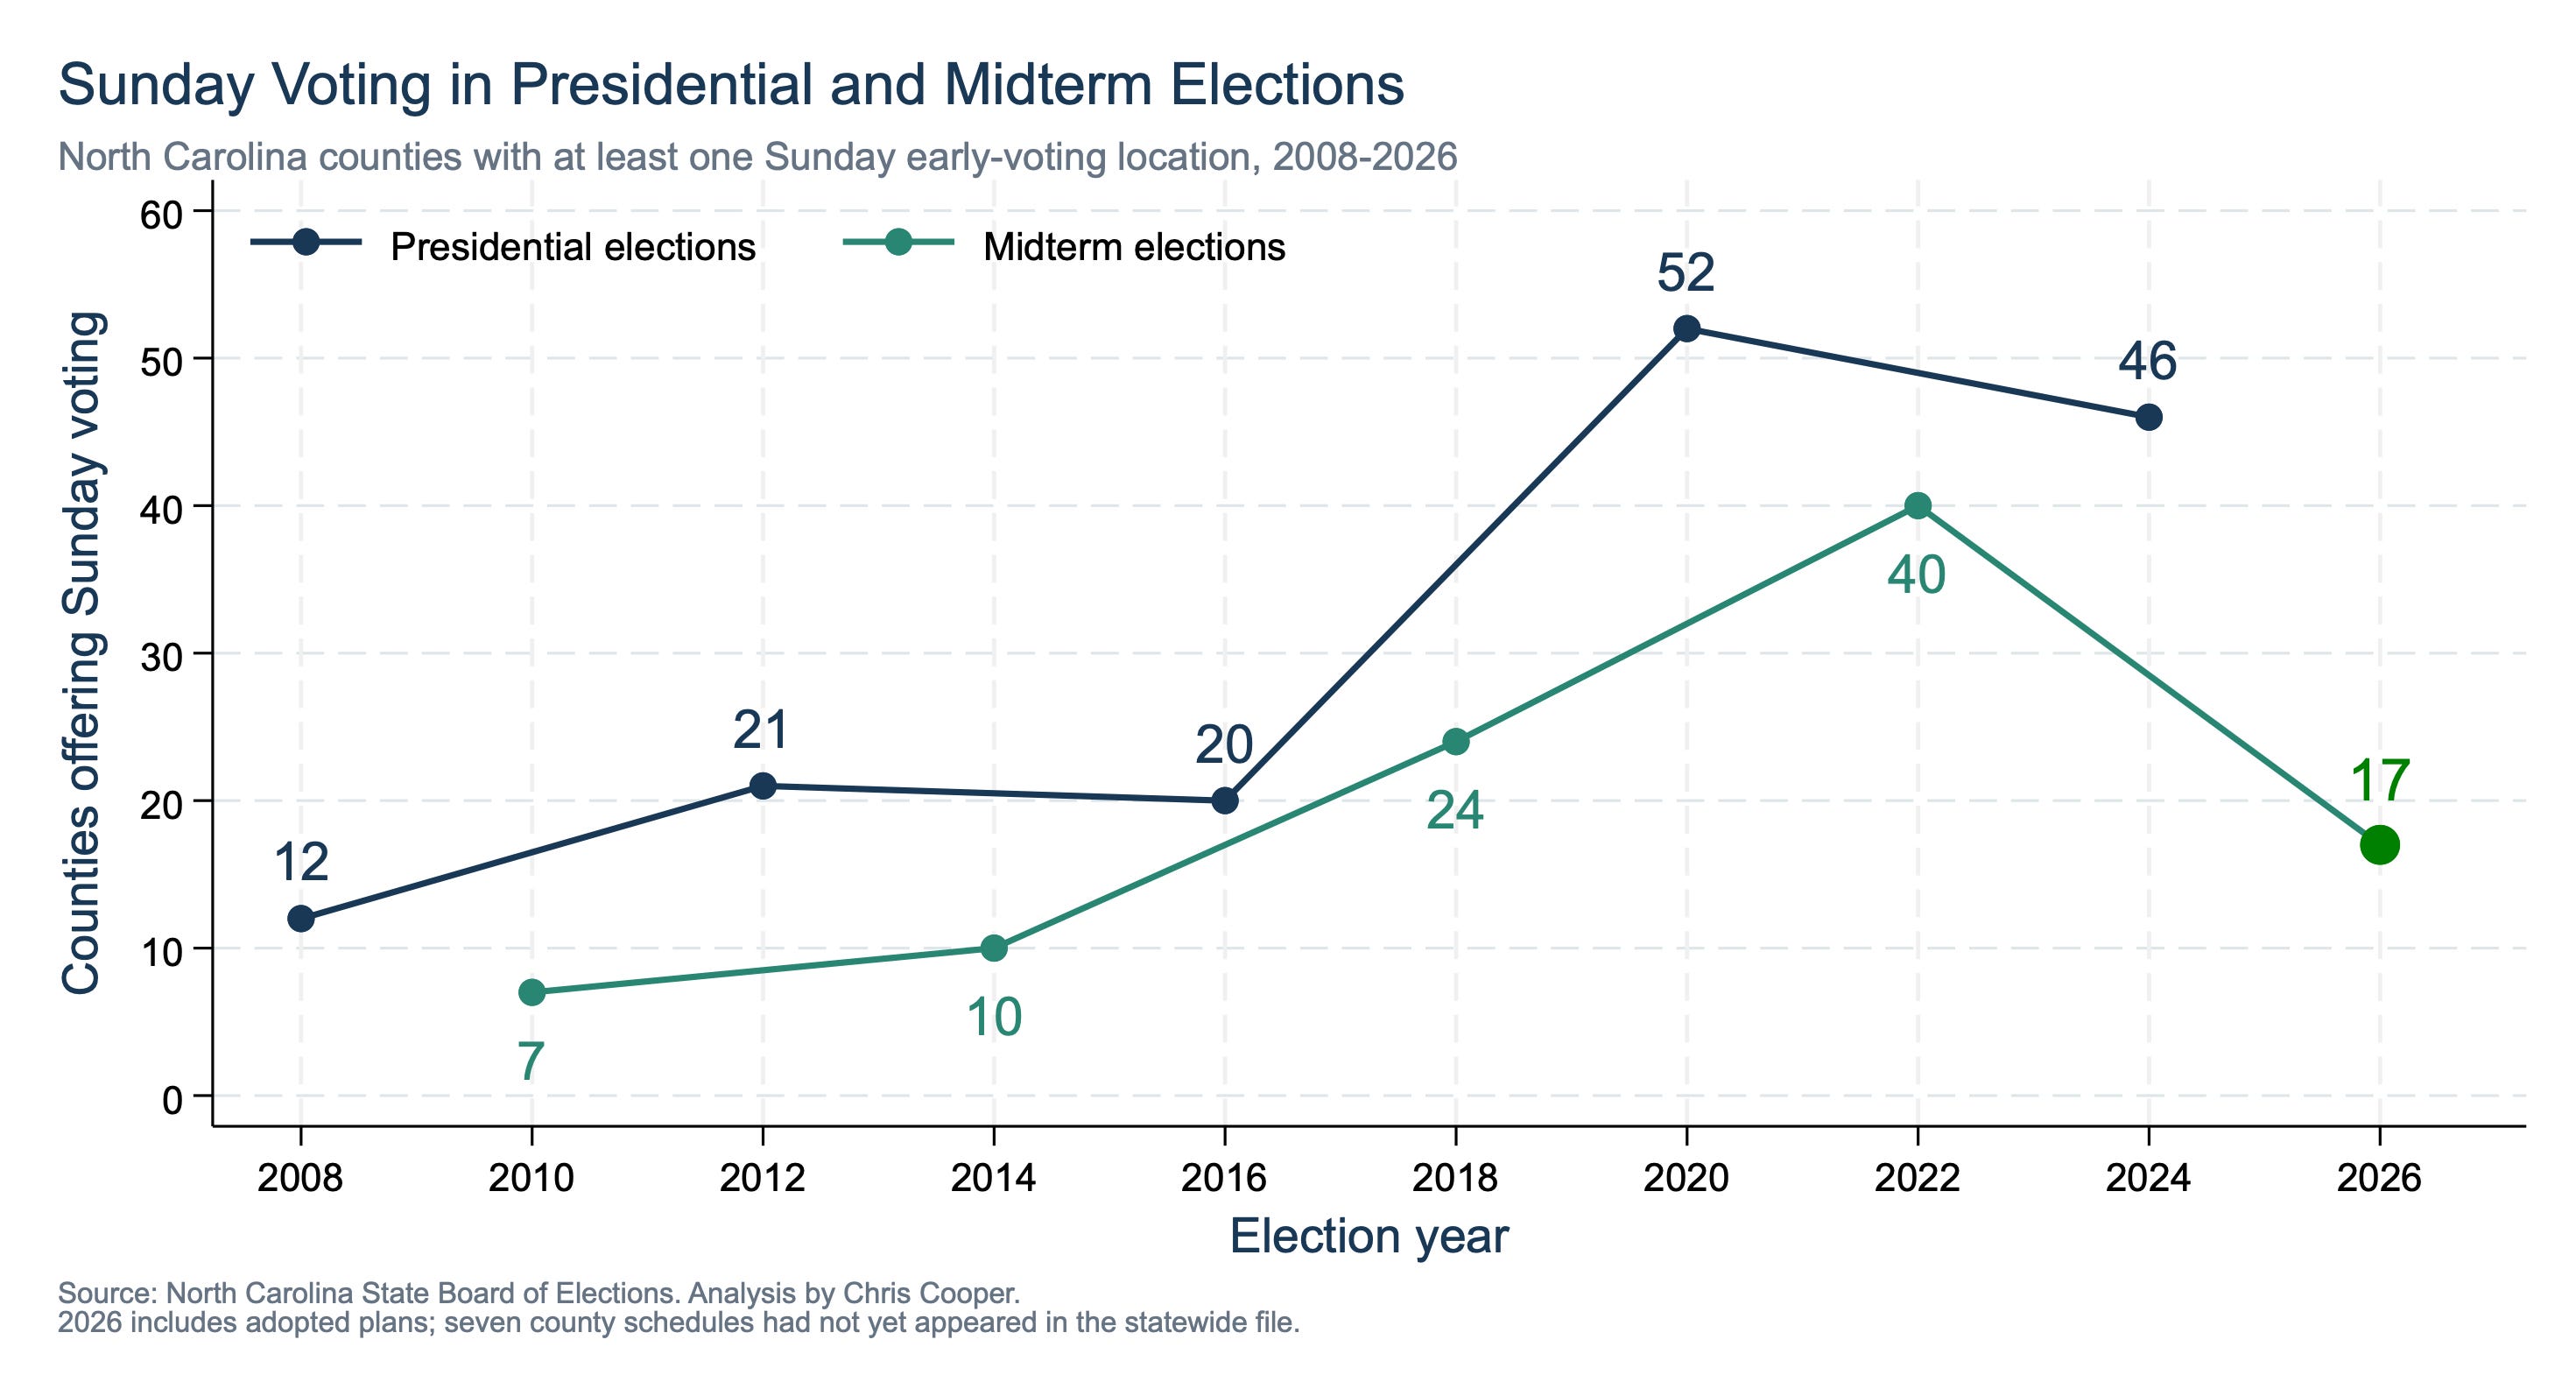
Are Sunday Voting Options Reduced? Yes
People may disagree about whether this is a feature or a bug of the new plan, but there’s no question that Sunday voting access decreased considerably from the last midterm. In 2022, 40 counties offered at least one Sunday early voting location; in 2026, it will be 17. No county added Sunday voting in 2026 that did not have it in 2022.
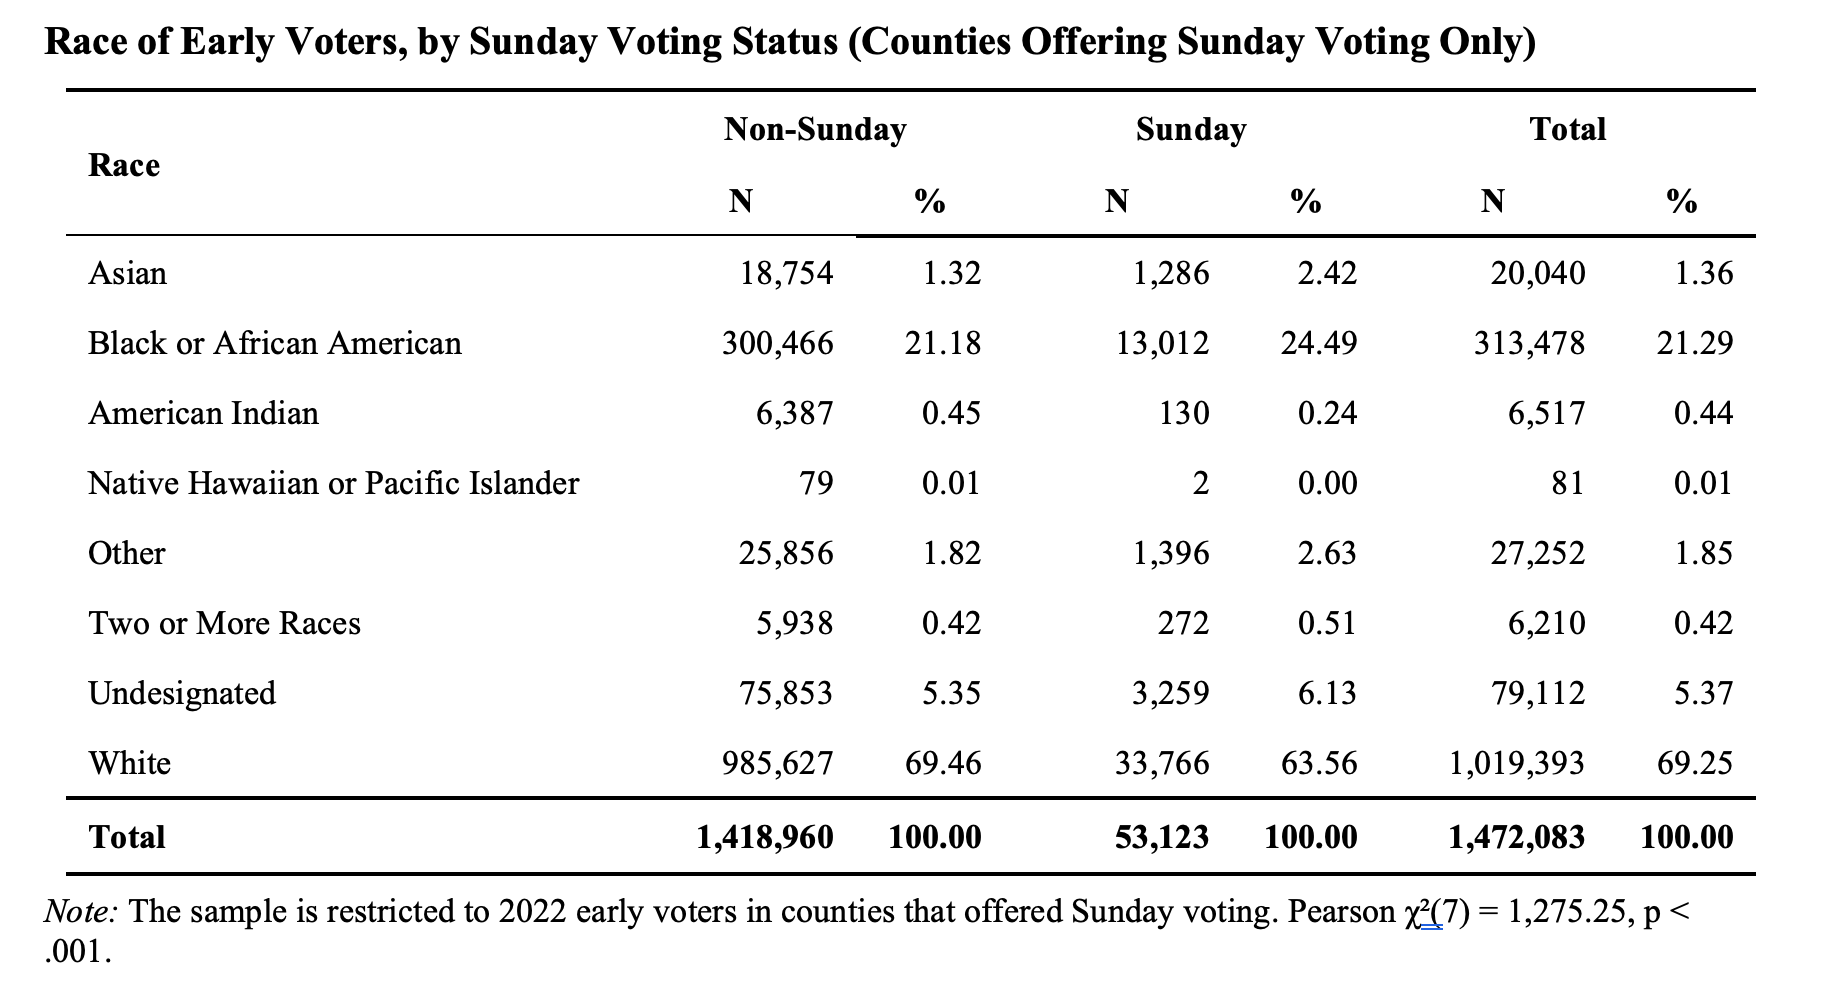
The table below shows the racial composition of Sunday voters compared with voters who cast ballots on other days in 2022.7 The bottom line is that Sunday voters are more likely to identify as a member of a racial minority.8
Were College Campus Voting Sites Cut? Yes, by a bit.
Some of the most controversial site decisions are about college student voting—and more specifically, whether it is a good idea to have early voting sites on college campuses.
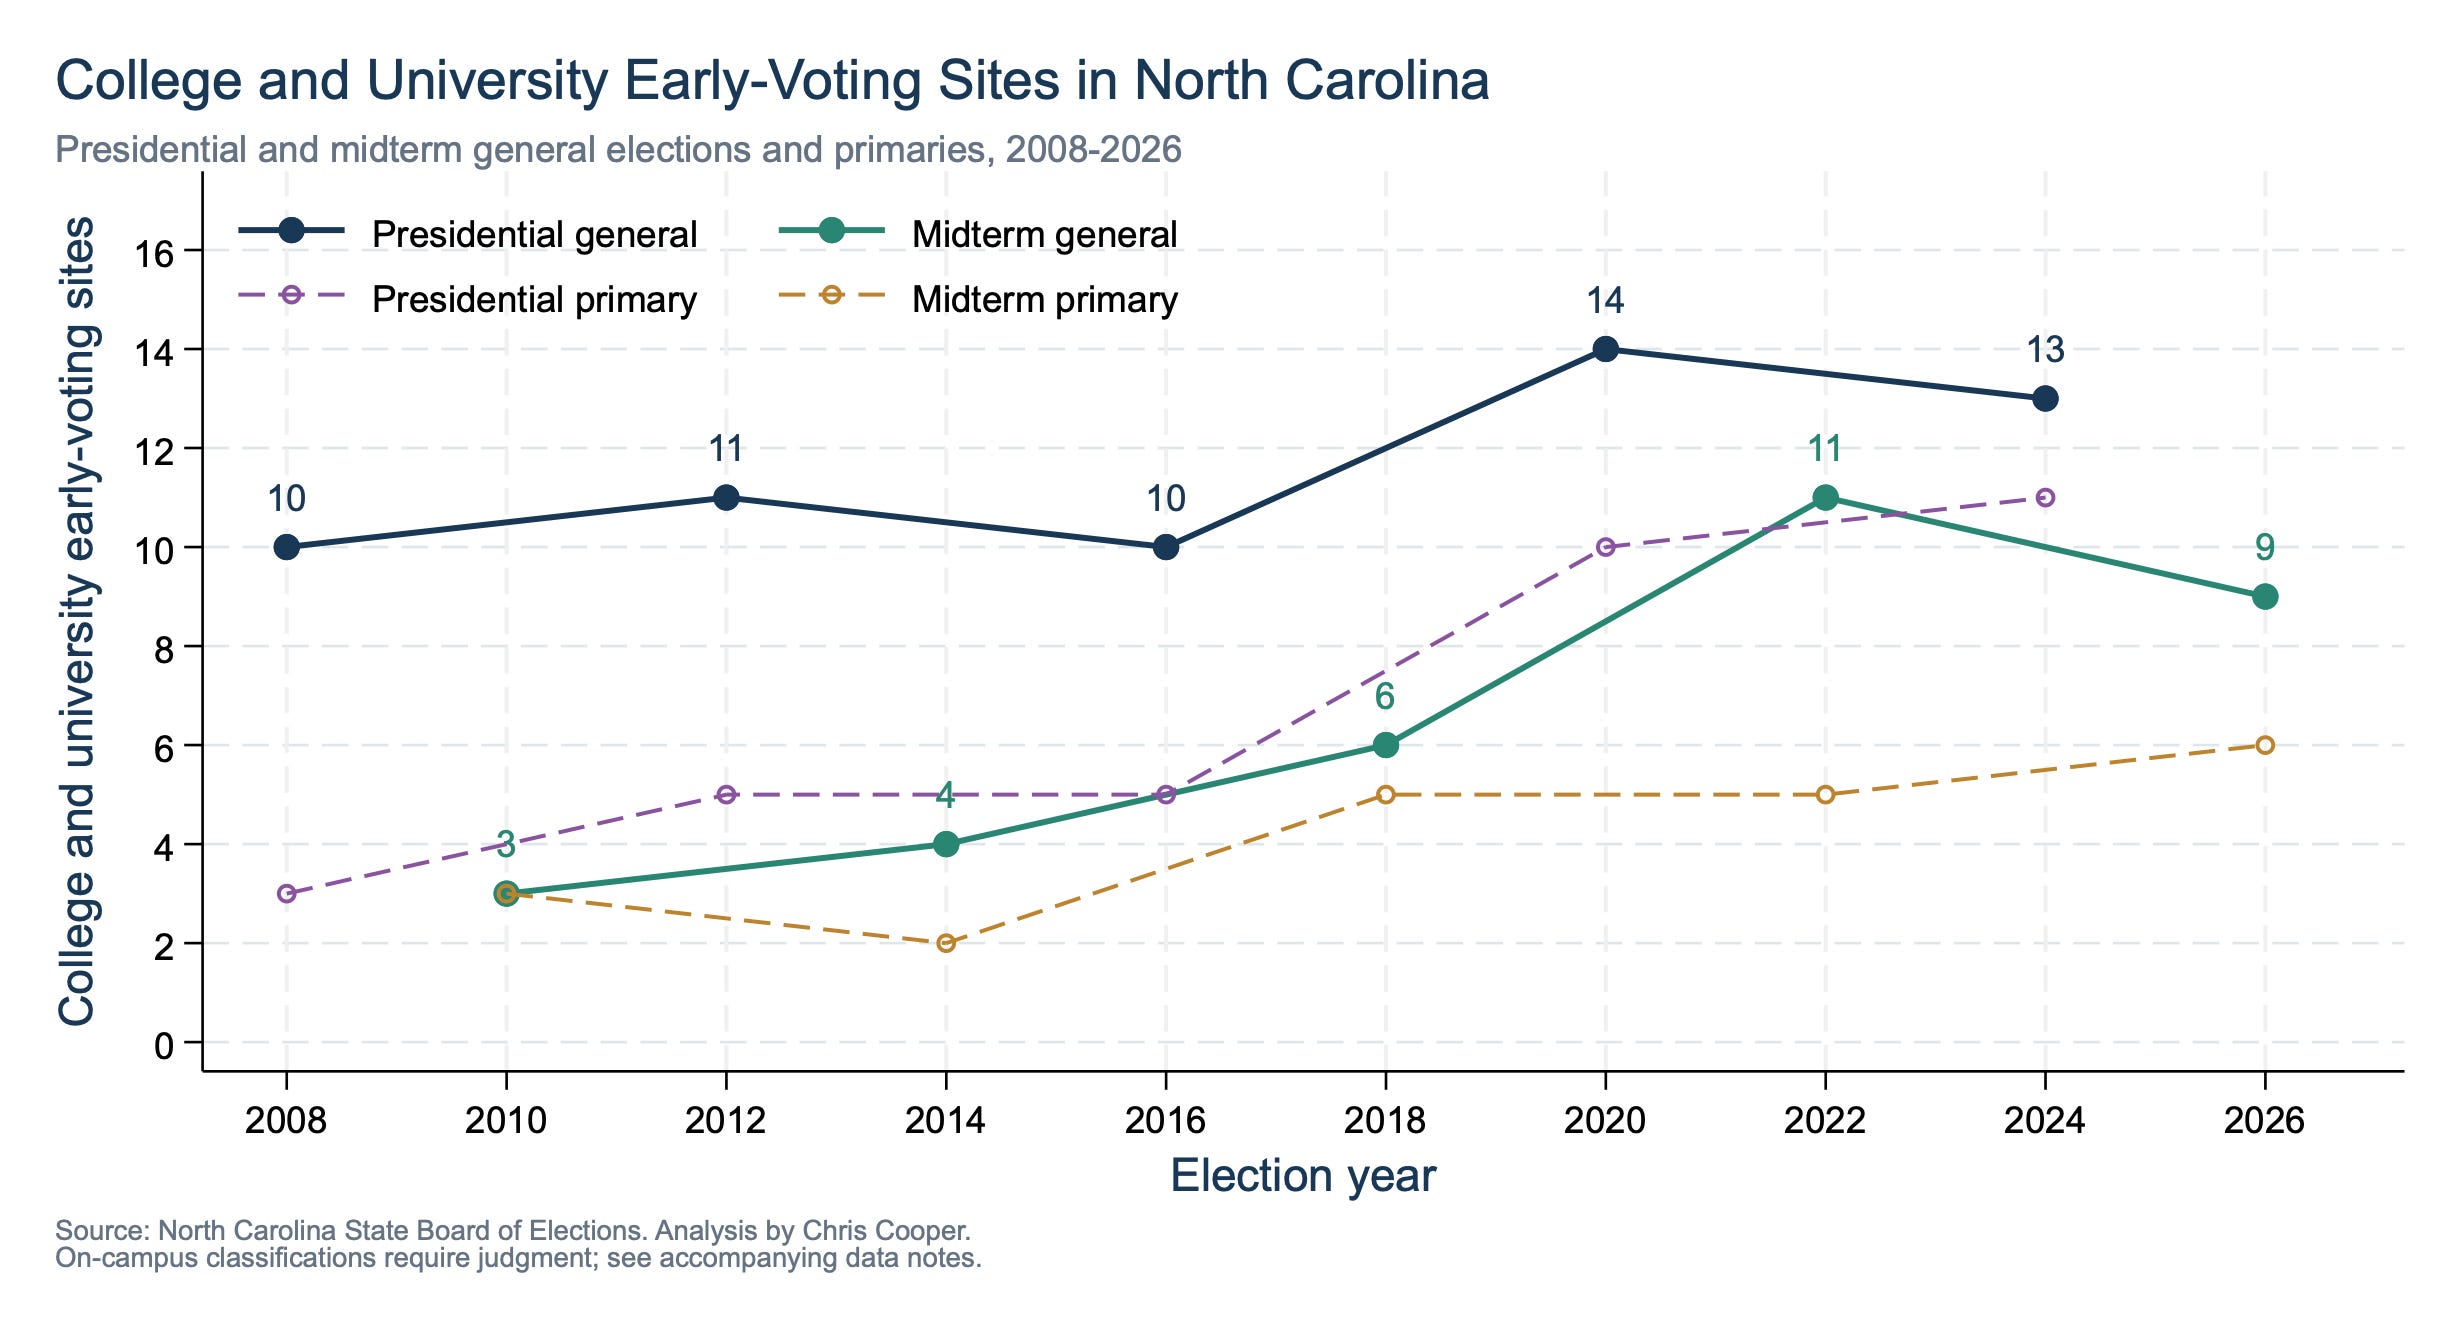
The graph below shows my best attempt to quantify these changes. The teal line is the midterm general election—the one you want to follow to understand how this year fits into comparable elections.
As you can see, there is a slight decrease in college campus voting sites in 2026, although the number remains the second highest for a midterm since at least 2010.9
The Bottom Line
Now that you’ve gotten to the bottom, I’ll give you the payoff that you probably wanted at the top. The table below has most of the metrics on changes from 2022 that you care about in one place.
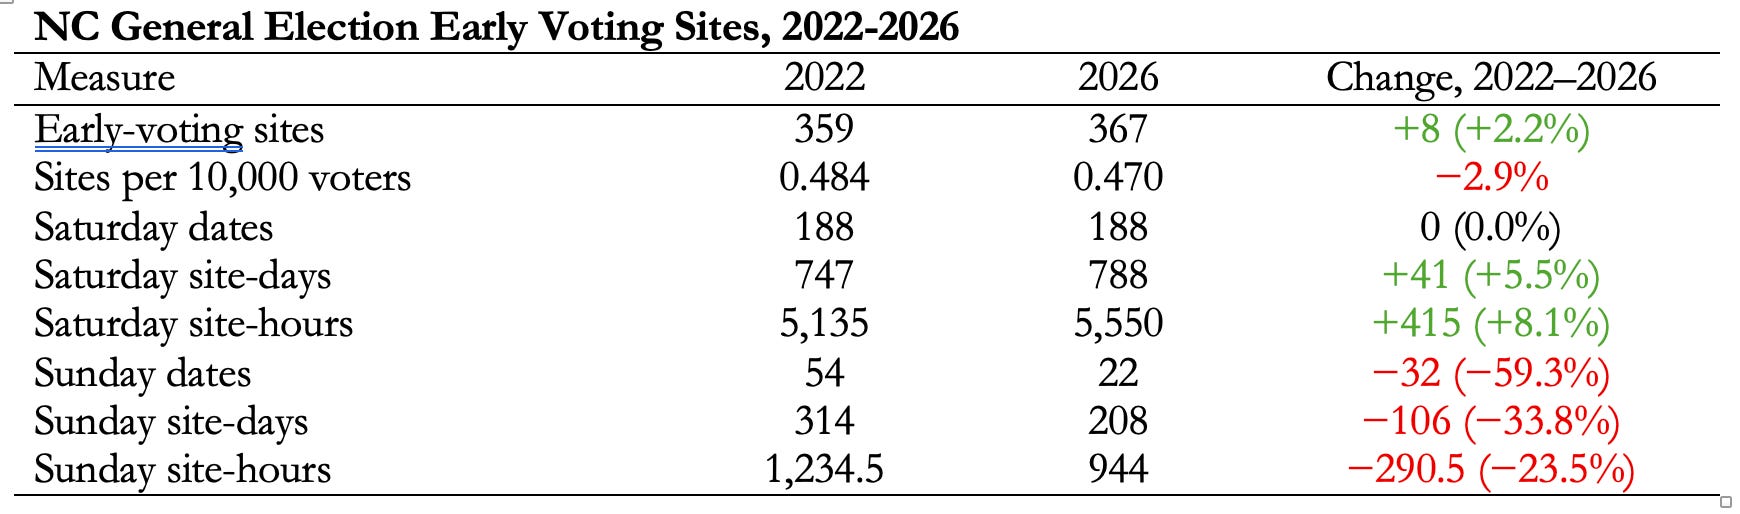
As you can see, it really is a mixed bag. Sites are up; sites per 10,000 voters are down; Saturday site-days and hours are up; Sunday dates and hours are down.
But statewide averages only tell part of the story. Changes that look small from 10,000 feet may matter a great deal in a particular county, community or campus.
So, does this year have better access than ever before? Probably not. Is the sky falling? Probably not either.
I have written previously about the content of those plans in the primary, after the first 80 plans were approved, and the nature of the disagreement about the 20 non-unanimous plans.
Ninety-three final plans appear on the NCSBE website. For the other seven counties, I use notes I took from the NCSBE meeting. I will confirm when the final plans for the remaining seven are posted and note any adjustments here. The 2026 registration figures reflect a July 28 snapshot; figures from previous elections reflect registration totals closest to the election. All of the raw data to reproduce almost everything in this post are available here. The racial composition data reported in the table about Sunday voting is reproducible from the November 2022 ENRS file.
To get these numbers, I combed through NCSBE meeting minutes. The relevant dates are: Sept 8, 2016, August 5, 2018, July 31, 2020, September 9, 2022, June 3, 2024, and August 20, 2026.
There is some overlap between counties with turnover and counties that have repeated non-unanimous plans.
The 2014 early voting period was shorter than the 2026 period, so similar site counts do not necessarily mean identical access. 2018 represents a notable dip because the Uniform and Expanded Early Voting Act increased the number of hours available statewide to cast an early ballot, but also brought about a decline in the total number of early voting locations in 70 of the state’s 100 counties.
Previous research demonstrates that moving voting sites does disrupt voter turnout for affected voters.
The sample is limited to just the counties that had Sunday voting in 2022. If a county did not have Sunday voting, it is not included.
Of the 23 counties that eliminated Sunday voting, 18 were rural and five were suburban. No urban counties eliminated it.
These results are somewhat sensitive to the coding, which is more difficult than you might expect. For example, I count NC State and WCU as having sites “on campus” even though both require an on-campus bus ride for most students. Likewise, I count the Chapel of the Cross at UNC as “on campus” even though it is in a building that is technically just off campus. The Board of Elections site in Pasquotank County, by contrast, is coded as “off-campus” because there was another site that was closer to campus (and technically on campus) that was considered. I have attempted to be as consistent as possible over all of these years.